Announcement

Collapse
No announcement yet.

Reply to "PivotPointAll efs" at YahooGroups

Collapse
X
 
  • Filter
  • Time
  • Show
Clear All
new posts

  • Reply to "PivotPointAll efs" at YahooGroups

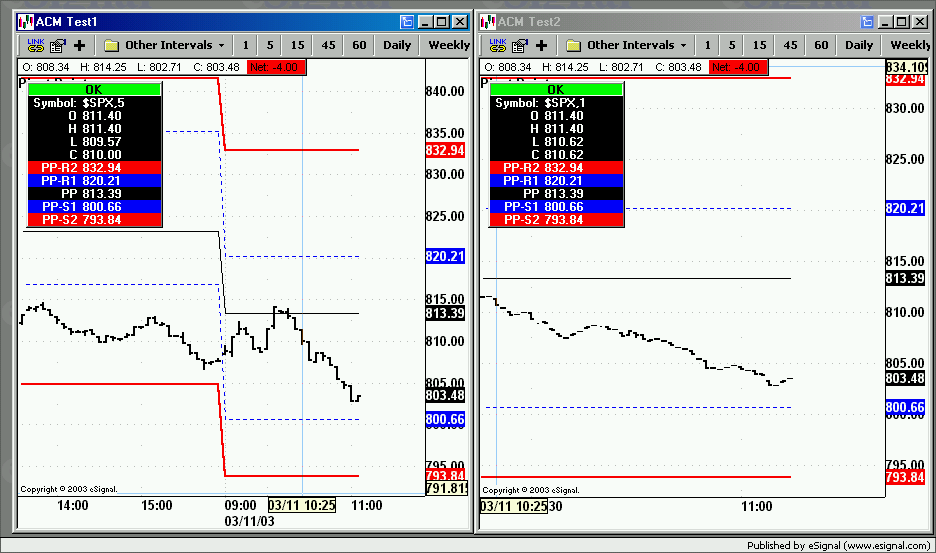
    While applying pivotpointsall.efs to $SPX 1min and 5min charts.
    If you compare the pivot point lines, you will find they are
    difference. I found out the close values (vC) are different in this
    two cases which results in the discrepency. Can somebody explain
    why the close values are different in this two scenaria?


    FWIW I am not seeing the differences you describe (see inline image below).
    Alex

    Last edited by ACM; 03-11-2003, 08:16 AM.

  • #2
    The efs I am using is downloaded from esignalcentral.
    I am attaching the screenshots in this post and the next post. You can see the difference of pivot point values.

    /************************************************** **************************************************
    Copyright © eSignal, a division of Interactive Data Corporation. 2002. All rights reserved.
    This sample eSignal Formula Script (EFS) may be modified and saved under a new
    filename; however, eSignal is no longer responsible for the functionality once modified.
    eSignal reserves the right to modify and overwrite this EFS file with each new release.

    @version 2.0
    ************************************************** **************************************************/


    function preMain() {
    setPriceStudy(true);
    setStudyTitle("Pivot Points");
    setCursorLabelName("PP-R2", 0);
    setCursorLabelName("PP-R1", 1);
    setCursorLabelName("PP", 2);
    setCursorLabelName("PP-S1", 3);
    setCursorLabelName("PP-S2", 4);


    // R2
    setDefaultBarStyle(PS_DASH, 0);
    setDefaultBarFgColor(Color.RGB(255,0,0), 0);
    setDefaultBarThickness(2, 0);

    // R1
    setDefaultBarStyle(PS_DOT, 1);
    setDefaultBarFgColor(Color.RGB(0,0,255), 1);
    setDefaultBarThickness(2, 1);

    // Pivot Point
    setDefaultBarStyle(PS_SOLID, 2);
    setDefaultBarFgColor(Color.RGB(0,0,0), 2);
    setDefaultBarThickness(2, 2);

    // S1
    setDefaultBarStyle(PS_DOT, 3);
    setDefaultBarFgColor(Color.RGB(0,0,255), 3);
    setDefaultBarThickness(2, 3);

    // S2
    setDefaultBarStyle(PS_DASH, 4);
    setDefaultBarFgColor(Color.RGB(255,0,0), 4);
    setDefaultBarThickness(2, 4);
    }

    // Start of Performance addition
    var vLastRawTime = null;
    var vLastPP = null;
    var vLastPPR1 = null;
    var vLastPPR2 = null;
    var vLastPPS1 = null;
    var vLastPPS2 = null;
    var vLastArray = null;
    var vSymbol = null;
    var vInterval = null;


    function main() {
    var vH;
    var vL;
    var vC;
    var vRawTime;
    var vBarTime;
    var vIndex;

    var nState = getBarState();
    if(nState == BARSTATE_ALLBARS) {
    vLastRawTime = null;
    vLastArray = null;
    vLastPP = null;
    vLastPPR1 = null;
    vLastPPR2 = null;
    vLastPPS1 = null;
    vLastPPS2 = null;
    vInterval = getInterval();
    vSymbol = getSymbol();
    vSymbol += ",D";
    }

    vRawTime = getValue("rawtime");
    if(vRawTime == null)
    return;

    vRawTime = Math.floor(vRawTime / RawTime.DAY);

    // Start of Performance addition
    if(vRawTime != null && vLastRawTime != null) {
    if(vRawTime == vLastRawTime) {
    return vLastArray;
    // return new Array(vLastPP, vLastPPR1, vLastPPR2, vLastPPS1, vLastPPS2);
    }
    }


    if(vInterval == null)
    return null;

    if(vInterval == "D")
    return null;

    if(vInterval == "W")
    return null;

    if(vInterval == "M")
    return null;

    if(vInterval == "T")
    return null;

    vBarTime = getValue("time");
    if(vBarTime != null) {
    vAbsTime = getPreviousTradingDay(vBarTime, vSymbol);
    if(vAbsTime == null)
    return;

    vIndex = getFirstBarIndexOfDay(vAbsTime, vSymbol);
    if(vIndex != null) {
    vH = getValueAbsolute("High", vIndex, vSymbol);
    vL = getValueAbsolute("Low", vIndex, vSymbol);
    vC = getValueAbsolute("Close", vIndex, vSymbol);
    //debugPrintln("H = " + vH);
    //debugPrintln("L = " + vL);
    //debugPrintln("C = " + vC);


    if(vH != null && vL != null && vC != null) {
    vLastPP = (vH + vL + vC) / 3;
    vLastPPR1 = 2 * vLastPP - vL;
    vLastPPS1 = 2 * vLastPP - vH;
    vLastPPR2 = (vLastPP - vLastPPS1) + vLastPPR1;
    vLastPPS2 = vLastPP - (vLastPPR1 - vLastPPS1);
    vLastRawTime = vRawTime;
    vLastArray = new Array(vLastPPR2, vLastPPR1, vLastPP, vLastPPS1, vLastPPS2);

    return vLastArray;
    }
    }
    }

    return null;

    }
    Attached Files

    Comment


    • #3
      The 5min chart.
      Attached Files

      Comment


      • #4
        Hello clearpicks,

        There was a bug found with Formulas/Pivots/PivotPointAll.efs related to the rawtime call on a 1-minute chart. Please try the updated formula: PivotPointAllnew.efs.

        Regards,
        Jason K.
        Project Manager
        eSignal - an Interactive Data company

        EFS KnowledgeBase
        JavaScript for EFS Video Series
        EFS Beginner Tutorial Series
        EFS Glossary
        Custom EFS Development Policy

        New User Orientation

        Comment


        • #5
          still not correct

          PivotPointsNew.efs is still buggy. During the trading hour, if you reload the pivotpointsnew.efs in $spx 1min chart, you will find the point points calculated changes every time you reload it. It seems it can not get the close price correctly. When the market is closed, the close prices won't change, thus the pivot points are of correct value. During the trading hour, if the pivotpoints.efs starts running before the market is open, then it is of no problem. But if it is opened after the market is open, then all pivot points are not correct. For all other intraday time frames, the same problem exists.
          Last edited by clearpicks; 03-12-2003, 08:51 AM.

          Comment


          • #6
            Hello clearpicks,

            I've tested the reloading issue and I'm not experiencing the same behavior you are. I think the problem is external to the formula itself. Let's explore some other possibilities. For starters, what is the version and build number you are using (Help/About)? FYI, I was testing with 7.2 build 544.
            Jason K.
            Project Manager
            eSignal - an Interactive Data company

            EFS KnowledgeBase
            JavaScript for EFS Video Series
            EFS Beginner Tutorial Series
            EFS Glossary
            Custom EFS Development Policy

            New User Orientation

            Comment


            • #7
              Re: Reply to post 'Reply to "PivotPointAll efs" at YahooGroups'

              clearpicks
              Have you been running these pivot efs on existing charts in your layout?
              If yes have you tried to create a new chart and run any of the pivot efs on
              it to see if that changes anything?
              You may also want to go into the eSignal folder and rename the Default.ach
              file and then create a new chart in the application
              Also I imagine that you are on East Coast time if your Time Template is
              showing 9 :30-16:00 in the images you posted. Is that the case?
              FWIW I ran the formula you posted yesterday and it was working fine here.
              Alex

              Comment


              • #8
                I am using 7.2 Build 544
                I tried to new an advanced chart and apply pivotpointsnew.efs and still encounter the same problem.

                Comment


                • #9
                  Re: Reply to post 'Reply to "PivotPointAll efs" at YahooGroups'

                  clearpicks
                  Have you also tried renaming the default.ach file, then opening a new Adv
                  Chart in eSignal and running the efs on that new chart?
                  Another suggestion would be to post your Layout at FileShare in the eSignal
                  group so Jason or someone else can take a look at it..
                  To do this you would use the Publish Page to FileShare in the
                  eSignalCentral Toolbar.
                  Alex

                  Comment


                  • #10
                    After renaming default.ach, it seems work well. What is the usage of Default.ach?

                    Comment


                    • #11
                      clearpicks
                      Default.ach is the default chart that comes up whenever you load a new Advanced Chart.
                      It is possible that it got corrupted at some point with an earlier version and you were just carrying it over with every upgrade.
                      Anyhow you can now create your own default.ach.
                      Once you have set up a new chart to look the way you want, right click the chart and select Style Template-> Set as Default.
                      From then on every time you load a new Advanced Chart it will always come up with the settings you saved.
                      Alex

                      Comment

                      Working...
                      X