Announcement

Collapse
No announcement yet.

TRIN, TRINQ and TICK "Indicators"

Collapse
X
 
  • Filter
  • Time
  • Show
Clear All
new posts

  • TRIN, TRINQ and TICK "Indicators"

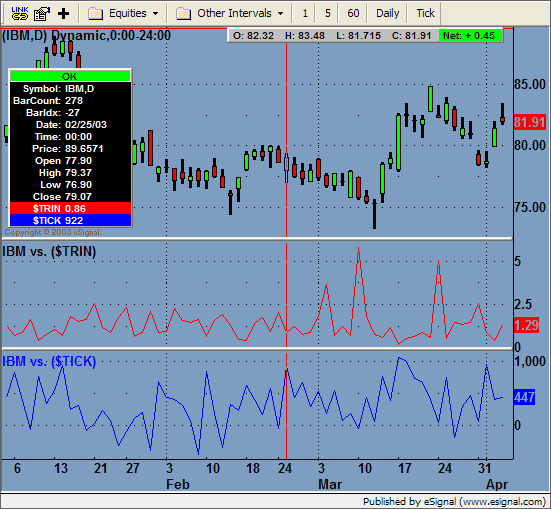
    HELP!!

    I am interested in incorporating TRIN, TRINQ and TICK as indicators displayed below the price data in an advanced chart, and am having some trouble.

    First, I have written a simple TRIN & TRINQ combined indicator, which should show up near each other on the same indicator pane. However, for some reason I can't fathom, the pane comes up blank. Any help with fixing this would be greatly appreciated.

    Here's the efs:

    function preMain()
    {
    setStudyTitle("Trin & TrinQ");
    setCursorLabelName("TRIN & TRINQ");

    setPlotType(PLOTTYPE_LINE, 0);
    setPlotType(PLOTTYPE_LINE, 1);

    setDefaultBarFgColor(Color.blue,0);
    setDefaultBarFgColor(Color.red,1);

    }

    function main()
    {
    var vTrin = close(0, 1, "$trin");
    if (vTrin == null) vTrin = 0;

    var vTrinq = close(0, 1, "$trinq");
    if (vTrinq == null) vTrinq = 0;

    // debugPrint("trin=" + vTrin + ", trinq=" + vTrinq +"\n");

    return new Array(vTrin, vTrinq);
    }


    I also have a TICK indicator, which works as is. But what I'd really like is to see the all the TICK data for the current bar (OHLC), not just the close, and I'd like to see it in candlestick format. (Actually this could be any ticker, not just TICK. For example, it would be useful to see a candlestick of $SPX under the candlestick chart for an individual stock, etc.)

    Here's the efs for TICK:

    function preMain()
    {
    setStudyTitle("Tick");
    setCursorLabelName("TICK",0);
    setDefaultBarFgColor(Color.darkgreen,0);
    addBand( 1000, PS_SOLID, 1, Color.purple);
    addBand(-1000, PS_SOLID, 1, Color.purple);
    }

    function main()
    {
    /* Instead of returning just the close, is it possible to return
    OHLC and display it in candlestick form?
    */
    return close(0, 1, "$tick");
    }


    Thanks,
    Mikey

  • #2
    Hi,

    This works, I made two changes.

    PHP Code:
    function preMain()
    {
        
    setStudyTitle("Trin & TrinQ");
        
    setCursorLabelName("TRIN"0);
        
    setCursorLabelName("TRINQ"1);

        
    setPlotType(PLOTTYPE_LINE0);
        
    setPlotType(PLOTTYPE_LINE1);

        
    setDefaultBarFgColor(Color.blue0);
        
    setDefaultBarFgColor(Color.red1);

    }
        
    function 
    main()
    {
        var 
    vTrin  close(01"$TRIN");
        if (
    vTrin == nullvTrin 0;

        var 
    vTrinq close(01"$TRINQ");
        
        if (
    vTrinq == nullvTrinq 0;

       
    // debugPrintln("trin=" + vTrin + ", trinq=" + vTrinq);
        
        
    return new Array (vTrin[0], vTrinq[0]);

    Garth

    Comment


    • #3
      gspiker,

      Thanks you so much. It works!! Any idea why it needs the [0] after the vTrin and vTrinq variables? (I'm just curious.)


      Best Regards,
      Mikey

      Comment


      • #4
        Much as I wish I could tell you why, I really don't understand it myself. You are only grabbing one bar of data, so it shouldn't have to be treated as an array.

        Someone more EFS savy than me will have to answer that q.

        G
        Garth

        Comment


        • #5
          Trin-entered as a formula

          Since Trin does not post if there is no change in value, I would like to enter the formula as a separate indicator. Hopefully, it would always update and be easier visually & mentally.

          I know the formula for the NYSE Tick is $ADV/$DECL devided by $UVOL/$DVOL, but I do not know how to enter the formula as a separate indicator.

          Schafeses

          Comment


          • #6
            Schafeses,

            Trin symbols are already supplied by eSignal. They are $trin for NY trin, and $trinq for Nasdaq trin.

            What I'm really trying to do is get multiple time series into the same advanced chart. Imagine how easy it would be to align various indicators - not just the ones derived from price of the main issue, like MACD, etc. - but all the other market indicators we like to look at, like TICK, TRIN, ect. If they can be layered into the same advanced chart, we could more easily analyze when multiple events on each one align. We could change the timeframe (e.g., from 1-minute to 5-minute) and see all relevant market structure in a flash (instead of selecting different charts to see the various indicators).

            Some traders might say: just put up multiple timeframe windows for what you want to look at (e.g., 1- and 5-min charts for TICK, TICKI, TRIN, TRINQ, etc). My response is: how much screen real estate do you think I have?

            MetaStock allows the functionality I'm describing. I can create 3 sub-charts within a single char, and control the timeframe for all 3 by simply controlling the main graph window. A single cursor/cross-hair spans all graphs and shows me what I want.

            eSignal, however, has superior scripting (imo), plus a lot of other features I like. It's just this one feature I which eSignal had.

            Sorry for lengthy reply.

            Mikey

            Comment


            • #7
              Hello Mikey,

              The formula below will plot the closing values of any symbol you specify as a non-price study. You can apply the formula to your chart multiple times to display multiple symbols. After applying the formula, go to the "Edit Studies" option and enter the desired symbol.

              symbolCompareAsNPS.efs

              Jason K.
              Project Manager
              eSignal - an Interactive Data company

              EFS KnowledgeBase
              JavaScript for EFS Video Series
              EFS Beginner Tutorial Series
              EFS Glossary
              Custom EFS Development Policy

              New User Orientation

              Comment


              • #8
                JasonK,

                Thanks for the study.

                Mikey

                Comment


                • #9
                  Hi Jason K.

                  I applied your "symbol-compare efs" to an advanced price chart , and it was almost exactly what I have been looking for. Now, is it possible to edit this formula so that it applies TIKI extremes (+/- 26) only to the NYSE TICK chart? I have a formula for TIKI ($TICKI) extremes, but it only works on a NYSE TICK chart if it's separate from the price chart.
                  Thanks

                  Comment


                  • #10
                    Hello cerus,

                    Please post your formula for TIKI extremes and I'll see what we can do.

                    Thanks,
                    Jason K.
                    Project Manager
                    eSignal - an Interactive Data company

                    EFS KnowledgeBase
                    JavaScript for EFS Video Series
                    EFS Beginner Tutorial Series
                    EFS Glossary
                    Custom EFS Development Policy

                    New User Orientation

                    Comment


                    • #11
                      Hi,
                      Can someone post a "completed" symbolCompareAsNPS.efs
                      (eg - like the example below - IBM-vs-$TICK) so i can see where the symbols are imputted into the .efs study.

                      Thanks,
                      Paul

                      Comment


                      • #12
                        Hello Turlies,

                        If you just need to change the symbol for the study, right-click on your chart and go to the "Edit Studies" option. A Study Properties window will appear. From the drop down box at the top, select " ... Add Symbol" and then enter your symbol of choice in the text box under Formula Parameters.

                        If you want to make a modification to the study, "vSym" is the variable that you would set equal to your required symbol in the main() function. Alternately, you could hard code the symbol and replace vSym with a string representing your symbol (i.e. "$SPX") in the close() function in main().

                        SymbolCompareAsNPS.efs
                        PHP Code:
                        var vLoaded false;
                        var 
                        cSym "";
                        var 
                        vSym null;
                        function 
                        preMain() {
                            if (
                        vLoaded == false) {    
                                
                        setStudyTitle(" ... Add Symbol");
                                
                        setCursorLabelName("Add Symbol");
                                
                        setDefaultBarFgColor(Color.red);
                            } else {
                                if (
                        vSym != null) {
                                    
                        setStudyTitle(cSym " vs. ");
                                    
                        setCursorLabelName(vSym);
                                } else {
                                    
                        setStudyTitle(" ... Add Symbol");        
                                    
                        setCursorLabelName("Add Symbol");
                                }
                            }
                        }

                        function 
                        main(Symbol1) {
                            if (
                        vLoaded == false) {
                                
                        cSym getSymbol();
                                if  (
                        Symbol1 == null) {
                                    
                        vSym null;
                                } else {
                                    
                        vSym Symbol1;
                                }
                                
                        vLoaded true;
                                
                        preMain();
                            }

                            if (
                        vSym != null) {
                                var 
                        close(01vSym);
                                return 
                        b;
                            } else {
                                return;
                            }

                        Jason K.
                        Project Manager
                        eSignal - an Interactive Data company

                        EFS KnowledgeBase
                        JavaScript for EFS Video Series
                        EFS Beginner Tutorial Series
                        EFS Glossary
                        Custom EFS Development Policy

                        New User Orientation

                        Comment


                        • #13
                          Hi Jason,
                          Thanks for the reply, i've sorted it out now. Do you have any feedback on my other post "MAoverboughtOversold.efs"? - this is the formula downloaded from your efs database file share section.

                          Thanks
                          Paul

                          Comment


                          • #14
                            Would it be possible to add an additional study on top of another study? For example, maybe I want a moving average on top of the VS $%TICK indicator to get a feel for the tick consensus throughout the day?

                            Comment


                            • #15
                              Hello JT47319,

                              The attached formula may be what you are looking for. It plots the $TICK as a histogram with a 20 period simple MA. The length for the MA can be changed via the "Edit Studies" option.
                              Attached Files
                              Jason K.
                              Project Manager
                              eSignal - an Interactive Data company

                              EFS KnowledgeBase
                              JavaScript for EFS Video Series
                              EFS Beginner Tutorial Series
                              EFS Glossary
                              Custom EFS Development Policy

                              New User Orientation

                              Comment

                              Working...
                              X