shaeffer
You don't necessarily need an efs to invert $TRINQ. Use the following expression as the symbol and you will get the same result as with your efs
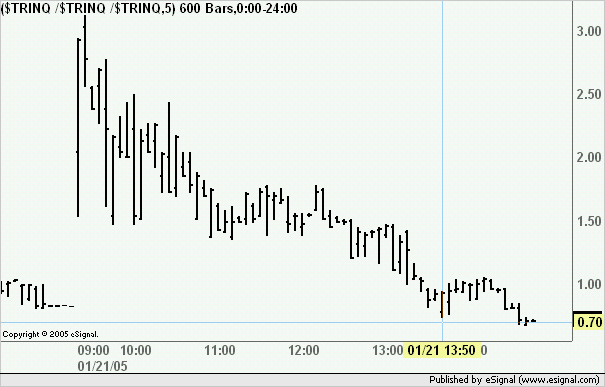
$TRINQ /$TRINQ /$TRINQ
(note the spaces before the operator sign)
This way you can also run any study directly on the chart
Alex
shaeffer
The new spread engine in 7.9 requires that a space be put before and after the operator ie $TRINQ / $TRINQ / $TRINQ.
Having said that the new spread engine now allows you to avoid the workaround that was otherwise required and insert directly 1 / $TRINQ to invert the symbol.
You can also save the spread with a name of your choice so that you do not need to type it every time. To do that select Tools->Spread Symbol Settings from the main menu
Alex
But now my (5 minute) one-day-only time template doesn't work for this anymore. Instead I'm getting today plus the previous 3 days of data. Yet this same time template is giving me one day only of data for $tickq and $Voldq, as always.
And instead of first day data for $trinq starting at 6:30 pst, its starting at 7:30. And there's a gap on the right side of the chart, even after using the 'Home' key
Something weird is going on here?!?!
Can you view one-day-only of data for $trinq, starting at 9:30 est?
Hmmm, $TRINQ works ok (starts at 6:30 est, with one day only of data). So 1/$Trinq must be more than just an inverse calc - you mentioned the new spread engine, but I trade only stocks, not futures, so I don't really understand what 1/$Trinq is doing(and guess I don't need to).
I just want to view the inverse of $TRINQ so up is bullish and down is bearish, same as tickq and voldq. I suppose an efs could give me the inverse plot today, but per the thread you referenced, I'll watch for the fix.
shaeffer
1 / $TRINQ is just a mathematical equation used to invert the value. That is the same as doing $TRINQ / $TRINQ / $TRINQ in version 7.8 where the first symbol divided by the second symbol is equal to one. That workaround was necessary in versions 7.8 (or earlier) because those versions could not plot spreads that contained numbers. The new spread engine is instead capable of resolving complex equations and can use numbers so you no longer need that workaround.
Alex
Ok, so 1 / $TRINQ is just simple math. I guess what confused me was mention of the 'spread engine' - it sounded like something that calculated the difference between cash and futures.
Is the spread engine some generic math module within the eSignal system? Even then, I thought as a rule, eSignal just transmitted raw data, so the 1/x calc would occur on my computer?
shaeffer
The spread engine is a module in the application that allows you to create composite symbols which can be the result of simple or complex spreads/equations between two or more securities and/or numerical constants
You can assign a name of your choice to these spreads/equations which you can then use to call them in a chart, quote window, etc. In your case you would create the equation 1 / $TRINQ in the Spread Symbol Settings tool and call it for example MYTRIN. At that point to create the chart for the inverted $TRINQ you would simply use MYTRIN as the symbol
Hope this helps
Alex
I input the Symbol "1 / $trinq" to view an intraday chart of the inverse of $trinq. I use a time template to try to restrict this chart to regualr market hours for one day only. But for some reason I get data for multiple days. Is there another way to restrict this to one day only?
shaeffer
If I remember correctly this issue has been reported also by others and eSignal has indicated that it would be fixed in one of the upcoming builds. I don't believe there is a workaround at this time.
Alex
Recently my 5 minute chart using symbol 1/ $Trinq just stops updating as of noon est. So I want to try an EFS to calculate and plot the Trinq inverse.
But I don't want to add this Inverse Trinq EFS to another chart - all I want to see is it alone. Can this be done, or does an EFS have to be added to a chart with some other symbol?
 Tweet
Tweet
Comment