EFS
Announcement
Collapse
No announcement yet.
Last 5 places of a Moving average
Collapse
X
-
Hello
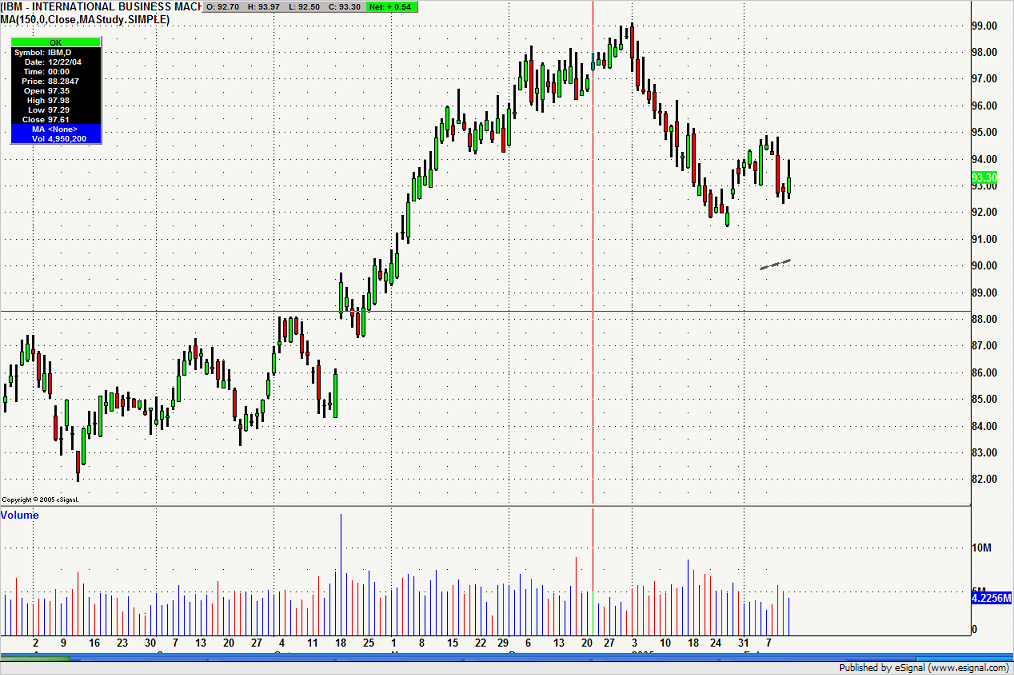
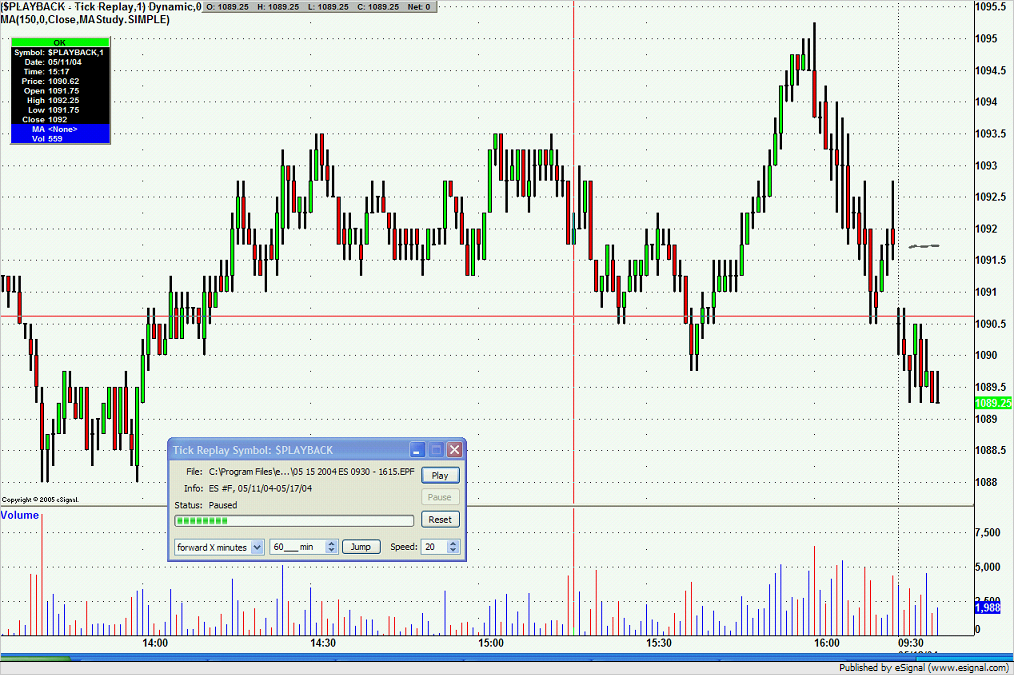
I’m trying to minimize the number of lines on me charts. Some of the lines I just need the end of it.
Currently I’m using:
drawLineRelative(-1, vMA1.getValue(MAStudy.MA,-1), 0, vMA1.getValue(MAStudy.MA,0), PS_SOLID, 3, Color.RGB(102,102,102), 0 );
drawLineRelative(-2, vMA1.getValue(MAStudy.MA,-2), -1, vMA1.getValue(MAStudy.MA,-1), PS_SOLID, 1, Color.RGB(102,102,102), 1 );
drawLineRelative(-3, vMA1.getValue(MAStudy.MA,-3), -2, vMA1.getValue(MAStudy.MA,-2), PS_SOLID, 3, Color.RGB(102,102,102), 2 );
drawLineRelative(-4, vMA1.getValue(MAStudy.MA,-4), -3, vMA1.getValue(MAStudy.MA,-3), PS_SOLID, 1, Color.RGB(102,102,102), 3 );
drawLineRelative(-5, vMA1.getValue(MAStudy.MA,-5), -4, vMA1.getValue(MAStudy.MA,-4), PS_SOLID, 3, Color.RGB(102,102,102), 4 );
To plot the last 5 places of the moving average.
Is there a better or more efficient way to plot the last 5 places of the Moving Average?
Thank you,
Ketoma
-
-
-
Hi ketoma21,
Since the efs you posted was from the same basic study as the one I used, I felt the clearest explanation was to just post the efs I was using.PHP Code:/***********************************************
Alexis C. Montenegro © July 2003
Use and/or modify this code freely. If you redistribute it
please include this and/or any other comment blocks and a
description of any changes you make.
*************************************************/
/* by S. Hare
modified on 2/11/2004 to add a section to plot only the last 5 values
also changed vMA to vMA1, steps added designated with "a"
*/
var vMA1 = null;
var macount = 0;//a
var thick = 1;//a
function preMain() {
setPriceStudy(true);
setStudyTitle("MA");
setCursorLabelName("MA", 0);
setDefaultBarFgColor(Color.blue, 0);
setDefaultBarThickness(1,0);
var fp1 = new FunctionParameter("Length", FunctionParameter.NUMBER);
fp1.setLowerLimit(1);
fp1.setDefault(10); //Edit this value to set a new default
var fp2 = new FunctionParameter("Offset", FunctionParameter.NUMBER);
fp2.setDefault(0); //Edit this value to set a new default
var fp3 = new FunctionParameter("Source", FunctionParameter.STRING);
fp3.setName("Source");
fp3.addOption("Close");
fp3.addOption("High");
fp3.addOption("Low");
fp3.addOption("Open");
fp3.addOption("HL/2");
fp3.addOption("HLC/3");
fp3.addOption("OHLC/4");
fp3.setDefault("Close"); //Edit this value to set a new default
var fp4 = new FunctionParameter("Type", FunctionParameter.STRING);
fp4.setName("Type");
fp4.addOption("MAStudy.SIMPLE");
fp4.addOption("MAStudy.EXPONENTIAL");
fp4.addOption("MAStudy.WEIGHTED");
fp4.addOption("MAStudy.VOLUMEWEIGHTED");
fp4.setDefault("MAStudy.SIMPLE"); //Edit this value to set a new default
}
function main(Length,Offset,Source,Type) {
if (vMA1 == null) vMA1 = new MAStudy(Length, Offset, Source, eval(Type));
/*****************************************
Insert your code following this text block
Use vMA.getValue(MAStudy.MA) for your code
******************************************/
if (getBarState() == BARSTATE_NEWBAR) {//a
macount++;//a
if (macount>=5)macount = 0;//a
if (thick==1)thick=3;//a
else thick=1;//a
}//a
drawLineRelative(-1, vMA1.getValue(MAStudy.MA,-1), 0, vMA1.getValue(MAStudy.MA,0), PS_SOLID, thick, Color.RGB(102,102,102), "ma"+macount);//a
//return vMA1.getValue(MAStudy.MA);//a
}
Comment


Comment