Announcement

Collapse
No announcement yet.

setBarFgColor question

Collapse
X
 
  • Filter
  • Time
  • Show
Clear All
new posts

  • setBarFgColor question

    I was using the attached efs (excluding lines 46-51) in an intraday chart of $VOLDQ. In an attempt to change the bar Fg colors, I added the lines above, but can't get it to work - the added lines seem to be ignored.

    Any idea why?

    I also tried them within the line 21 'if' statement (what does 'rawtime' mean?)

    I don't know what the new version of EFS's will be about, but I sure hope its easier to use.

    Thanks
    shaeffer
    Attached Files

  • #2
    shaeffer

    the added lines seem to be ignored

    Which added lines?

    I also tried them within the line 21 'if' statement (what does 'rawtime' mean?)

    Anything enclosed in the if (getValue("rawtime",0) != nLastRawTime) statement (ie lines 21 to 44) will be executed only once during the duration of a bar.
    What happens is that in line 21 the efs retrieves the time of the current bar ie getValue("rawtime",0) and verifies that it is different from the value nLastRawTime. If it is different and the other conditions are met then it executes the commands contained in the if statement after which in lines 27 (and 33) it assigns the time of the current bar to the variable nLastRawTime. At that point for the duration of that bar the variable nLastRawTime will be always equal to getValue("rawtime",0) therefore those commands will not be executed. Once a new bar starts nLastRawTime and getValue("rawtime",0) will be different again thereby allowing those commands to be executed (once only as the cycle repeats itself)
    BTW rawtime is the number of seconds elapsed since 00:00:00 of January 1st 1970
    Hope this helps.
    Alex

    Comment


    • #3
      Hi Alex,

      Lines 46-51 are the seemingly 'ignored' lines. Actually, when I setPriceStudy(false), I could see the bar colors being changed. But when I setPriceStudy(true) (which I want), I can't see the colored bars (I guess those colored bars are hidden by the main plot of $VOLDQ)? So do I need to remove the main plot of $VOLDQ somehow(?), and have it plotted only from the efs?
      -------------------------------
      Good explanation of --- if (getValue("rawtime",0) != nLastRawTime) ---- thanks. Without that command, there could be multiple alerts within one bar timeframe? If so, that implies it would that also allow triggering of an alert before the close of the bar (if halfway through the bar duration the alert condition was met)? But then, this efs uses only getValue(closes), so could a mid-bar alert occur?

      Regards
      shaeffer

      Comment


      • #4
        shaeffer

        Without that command, there could be multiple alerts within one bar timeframe?

        That is correct. That if statement ensures that the commands contained in it will be executed only once for the entire duration of that bar.

        If so, that implies it would that also allow triggering of an alert before the close of the bar (if halfway through the bar duration the alert condition was met)?

        That is correct

        But then, this efs uses only getValue(closes), so could a mid-bar alert occur?

        On the current bar "close" is the same as saying "last" ie whatever the last traded price is. On historical bars "close" will be the closing value of the bar. To answer your question yes a mid-bar alert can occurr.
        Alex

        Comment


        • #5
          Hi Alex,

          Thanks Alex - I'm slowly learning.
          Does the command setComputeOnClose() truly use the Close (as opposed to Last)? If so, then I could use setComputeOnClose(), and remove the --if (getValue("rawtime",0) != nLastRawTime)-- statement, but then I would not get the earlier alerts - is that right?

          Back to that efs, any idea why my attempt to change the Bg colors of the $VOLDQ bars isn't working?

          Regards
          shaeffer

          Comment


          • #6
            shaeffer
            If you use setComputeOnClose() the efs will calculate only when a bar is completed therefore you would no longer need the if (getValue("rawtime",0) != nLastRawTime) condition to limit the alerts to once per bar. You would also no longer have intrabar alerts.
            As to your efs move lines 36-42 out of that condition and they will work. I would also suggest that - at least during the development stages of the efs - you use contrasting colors else you will not be able to see what is happening if the colors are all the same. That will help you better understand what the efs is doing.
            Also lines 46-51 are woirking correctly in as much as they color the plot vVolDQ. Again though using the same (or very similar color) does not help.
            Lastly lines 53-55 are working also
            Alex

            Comment


            • #7
              Hi Alex,

              I moved lines 36-42 out of the rawtime IF statement, as you suggested, and I changed the colors. Sorry about the non-contrasting colors.... the plan was to remove the fixed Bg colors, lines 53-55 (now removed), once I had the conditional BarFg colors working.

              Having done that, if I setPriceStudy(false), I can see the conditional BarFg colors of lines 46-51. But I don't want two plots of $Voldq using up monitor space.

              So I setPriceStudy(true), but then I don't see the conditional BarFg colors of lines 46-51 anymore. As I asked in my earlier note, is the chart window plot of $Voldq hiding the efs $Voldq BarFg colors? and if so, how do I get around that?

              Thank you
              shaeffer
              Attached Files

              Comment


              • #8
                shaeffer

                is the chart window plot of $Voldq hiding the efs $Voldq BarFg colors? and if so, how do I get around that?

                In some way it is because you have no thickness defined which sets it to the default of 1.
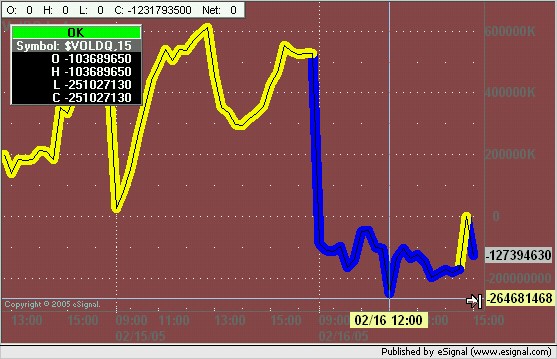
                Here is a possible solution. Set the chart to plot as a Line instead of Bar. Then in the efs add the following statements in preMain()
                setPlotType(PLOTTYPE_INSTANTCOLORLINE);
                setDefaultBarThickness(10,0);

                The result is shown in the image below
                Alex

                Comment


                • #9
                  Success! Thanks Alex.

                  Comment

                  Working...
                  X