Announcement

Collapse
No announcement yet.

EFS2 Custom Formulas

Collapse
X
 
  • Filter
  • Time
  • Show
Clear All
new posts

  • EFS2 Custom Formulas

    Hi everyone! Question from a newbee... in the study properties of the new custom formulas, I see that I can now view a different symbol and interval time frame than the current chart being viewed.
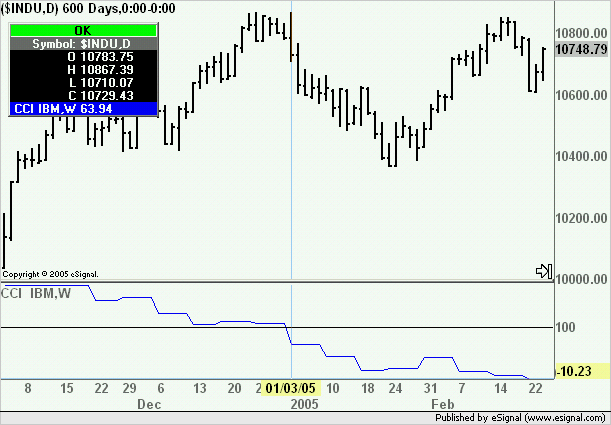
    Could it be possible to change the study title to reflect those changed parameters ? As an example, I have an es h5 60 min chart, while viewing a ym 10min macd below . However the title study just says MACD. It would be extremely helpful to see what I am charting and what time frame it is in. IE: YM MACD 10m.

    Thanks for a reply and a BIG "thank you" to those who brought E -signal to a new level of trading!

    ang
    ang.

  • #2
    ang
    Even though as I understand it setStudyTitle() should only be in preMain() it can be used also in main().
    In the image below you can see that I have set it up so that both the study title and the cursor label reflect the symbol and interval on which the study is based
    Alex

    Comment


    • #3
      ang
      Also, in Edit Studies there is a true/false switch to display or hide the parameters. If you set it to true it will display all the parameters including symbol and interval used
      Alex

      Comment


      • #4
        Hi Alexis,

        I took your suggestion and have coded the study title in the Main function and it works just fine. I didn't like using the parameter button because it lends way to much info about the chart that it didn't need.

        Another question I have, deals with again the new custom formulas, mainly the MACD. The ability to toggle the simple moving averages for the Oscillator and Signal Lines are not included with the new EFS2 Custom Formulas nor the Basic Formulas. The old MACD feature has this capability.

        Can you please show a way to include this in the new Custom Formula edit function?
        Thanks!

        ang
        ang.

        Comment


        • #5
          ang
          That option is not available in the EFS 2 version of the MACD.
          Alex

          Comment


          • #6
            Alex,

            Is it possible for you the provide a program to add a moving average to the existing code for me??

            While backtesting, I noticed a sizable increase to the bottom line by smoothing out the indicator. I don't know enough about programming to do this......

            Thanks for any help you can provide.

            Ang
            ang.

            Comment


            • #7
              Ang,

              At this stage of EFS2 development, we're heavily involved in testing and I don't think anyone really has time to create custom formulas right now. Once we get into production next month, we'll be better equiped to answer questions and assist users creating formulas. You may also be better off posting something like this on one of the other forums in the EFS Central area such as EFS Studies or New Study Suggestions.

              Thank you,

              Comment


              • #8
                I noticed in EFS 2 , that Woodies CCI chart has "shadows" at the end of the indicator that are overrunning the chart. Has any correction been made to correct this yet, or is there a workaround for it?

                Also.... As I was searching in the EFS Script Library under Strategy Functions under "Backtesting Operations", I noticed that the explanation for Strategy.isShort says :
                "returns true if currently long; otherwise, false".

                Is this statement correct or should it read :
                "returns true if currently short ; otherwise, false"???

                Since I am far from an expert on this matter, I just needed a little clarification.

                Thanks for any response...

                Angelo
                ang.

                Comment


                • #9
                  Hello Angelo,

                  That was a typo, thanks for catching that. It should read short and it is now updated.

                  I'm not sure what you are referring to with the "shadows." Post a chart image so I can see what you are referring to.
                  Jason K.
                  Project Manager
                  eSignal - an Interactive Data company

                  EFS KnowledgeBase
                  JavaScript for EFS Video Series
                  EFS Beginner Tutorial Series
                  EFS Glossary
                  Custom EFS Development Policy

                  New User Orientation

                  Comment


                  • #10
                    Hi Jason,

                    Thanks for the response! Here is the attached chart of Woodies CCI. As you can see, the 4 Logos "Woodies and CCI Club.com "
                    bleed into the end chart. It's a problem when charts are reduced
                    because they cover up the signal. I understand that this is a problem in EFS 2 only.

                    Thanks for your help!
                    Angelo
                    Attached Files
                    ang.

                    Comment


                    • #11
                      Dion, that's a bug that with 7.9, that drawTextAbsolute no longer defaults to Text.LEFT. I don't specifiy Text.LEFT in the distributed version which causes the failure.

                      Bernie

                      Comment


                      • #12
                        To all concerned...

                        I noticed the EFS 2 Toolbox needs a correction with the ( <-) Button ! It has a (neg) symbol..... it should be (<= ) instead.

                        Also, can anyone tell me if the ability to be able to change color parameters for the ADXDM is an oversight, or this is a planned change. In edit, there are no color parameters to change. The original ADXDM in EFS 2 colors could be changed.

                        Thanks again for the response.

                        By the way, is there a correction for Woodies CCI yet???
                        Bernie, where can I get the "distributed" version???

                        Angelo
                        Attached Files
                        ang.

                        Comment


                        • #13
                          Angelo
                          With regards to the option to change the colors that was removed to provide the script in its simplest form.
                          You should be able to easily add the required Function Parameters to include color selection for the various plots
                          Alex

                          Comment

                          Working...
                          X