 Tweet
Tweet
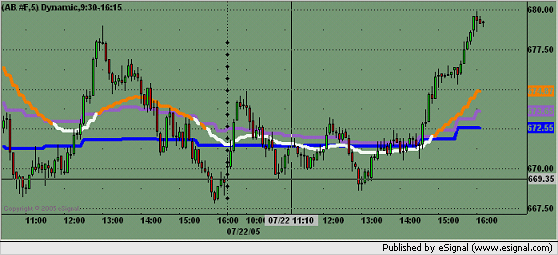
I would like to change the background color to yellow when LSMA is above EMA, and to grey when LSMA is below EMA. However, my chart doesn't look correct.... Pls help
This study plots the LSMA but not the EMA... but I am including another EMA line in the chart below so I can check whether the background color is correct or not.
- LSMA ("test.efs"): green line
- EMA: brown/blue line (brown if close < EMA, blue if close > EMA)
Pls note that the LSMA portion is downloaded from the forum and it works. And the EMA portion is taken from the builtin library directly.... so I don't understand why the background color is not correctly displayed.
Comment