Announcement

Collapse
No announcement yet.

MA of other symbol as nonprice study

Collapse
X
 
  • Filter
  • Time
  • Show
Clear All
new posts

  • MA of other symbol as nonprice study

    I'm a new user and I would like to do the following in EFS:

    ES #F should be the main symbol and i would like to have three different nonprice studies underneath(not overlaying each other!):

    a 5 SMA of $TICK
    a 10 SMA of $ADD
    a 5 SMA of $TRIN overlaying a 10SMA of $TRIN

    Does anyone have a solution?

    Thanks for help!
  • #2
    zotti
    You can find SymbolMA-EMA.efs here. This efs will plot the moving average (and the underlying price) of a symbol different from the one in the price window.
    At this time you must set the Time Template to the shorter of the trading hours. If for example you are plotting ES and the average is based on $TICK you need to set the Time Template to 9:30-16:00 (EST or equivalent if in different time zone). Once EFS2 is released and new formulas will be written to take advantage of its enhanced functionality this limitation will no longer exist.
    Alex

    Comment


    • #3
      Alex, thanks a lot! This is exactly what I needed!

      1) I'm using this study on a daily chart of ES #F and the Time Template is set to 15:30 - 22:00(based on the austrian time), but the charts still shows "Dynamic,0:00 -24:00". I guess this is the normal behaviour of daily charts and your tip with the 9:30 - 16:00 Time Template is relating only to intraday charts?

      2) I modified your efs a bit with another input parameter OHLC which represents four input parameters Open, High, Low, Close. I wanna plot a 5 SMA of the $TICK lows. If I use "Low" as input the chart of the MA looks exactly as I've used "Close" as parameter. What I'm doing wrong? The hand over of OHLC to main() is correct and shows "Low"

      function main(Symb,MALength,MAType,OHLC,Line1,Line2,LineCol or1,LineColor2) {

      var i;
      var vSum = 0.0;
      var vValue;
      var Source;
      // YOURS WAS: vValue = getValue("Close", 0, -MALength, Symb);
      vValue = getValue(OHLC, 0, -MALength, Symb);

      if(vValue == null) {
      return;
      }

      for(i = 0; i < MALength; i++) {
      vSum += vValue[i];
      }

      var vMA = (vSum/MALength);
      // YOURS WAS: var vSymb = getValue("Close", Symb);
      var vSymb = getValue(OHLC, Symb);
      .
      .
      .
      .
      Attached Files

      Comment


      • #4
        zottl
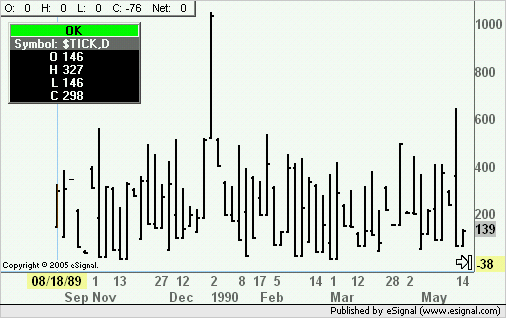
        if you look at the daily charts for $tick you will notice that it only shows the close so when calling for low it will return the tick at close,

        Comment


        • #5
          zotti

          I'm using this study on a daily chart of ES #F and the Time Template is set to 15:30 - 22:00(based on the austrian time), but the charts still shows "Dynamic,0:00 -24:00"

          Start/End times do not apply to Daily (or higher) intervals or to tick based charts.
          If you want to plot the RTH session only even for Daily bars you may want to use ES #F=2

          your tip with the 9:30 - 16:00 Time Template is relating only to intraday charts?

          That is correct.

          With regards to your point 2) as shogun said the O, H, L and C on a daily chart for $TICK are all the same value
          Alex

          Comment


          • #6
            Oh, yes i saw. Do you know how long these market internals like $TICK, $TRIN, $ADD are available? It seems only for a year.

            Thanks to you both!

            Comment


            • #7
              zotti
              As far as I can see $TICK goes back to 1989 and I would suspect the other symbols to have a comparable amount of historical data
              Alex

              Comment


              • #8
                Alexis, that's correct. But the SymbolMA-EMA studies of $TICK and $TRIN are stopping at 02/20/2004. The study of $ADD at 02/27/2004...

                zotti

                Comment


                • #9
                  zotti
                  That is probably because in the Time Template the Interval D is either set to Dynamic or not defined at all (which is the same as Dynamic). Create a User Defined interval for D and set it to load 2500 Bars (approximately 10 years of daily data) and you should see the historical plot of the efs go further back in time
                  Alex

                  Comment


                  • #10
                    Alexis, that was exactly the problem!

                    Thanks a lot
                    zotti

                    Comment

                    Working...
                    X