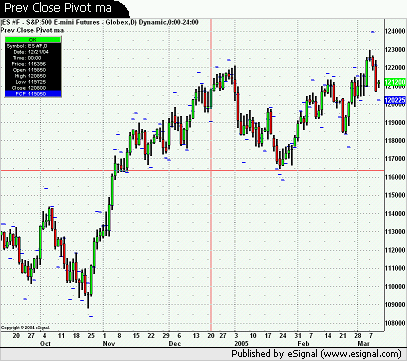
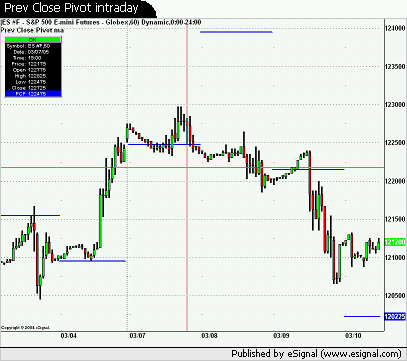
I am new to esignal and would appreciate help on following. Looks simple but still beyond my abilities.
I would like to draw the value of ROC(2) pivot next to the daily bar.
IF
Day1 = yesterday's close
Day2 = close 2 days ago
Day3 = close 3 days ago
THEN
Pivot1 = Day1 - Day3 + Day2
Is there a way to display Pivot1 on todays bar (Day0) as small dot or line?
Many Thanks!
I would like to draw the value of ROC(2) pivot next to the daily bar.
IF
Day1 = yesterday's close
Day2 = close 2 days ago
Day3 = close 3 days ago
THEN
Pivot1 = Day1 - Day3 + Day2
Is there a way to display Pivot1 on todays bar (Day0) as small dot or line?
Many Thanks!


Comment