Announcement

Collapse
No announcement yet.

Regression Lines

Collapse
X
 
  • Filter
  • Time
  • Show
Clear All
new posts

  • Regression Lines

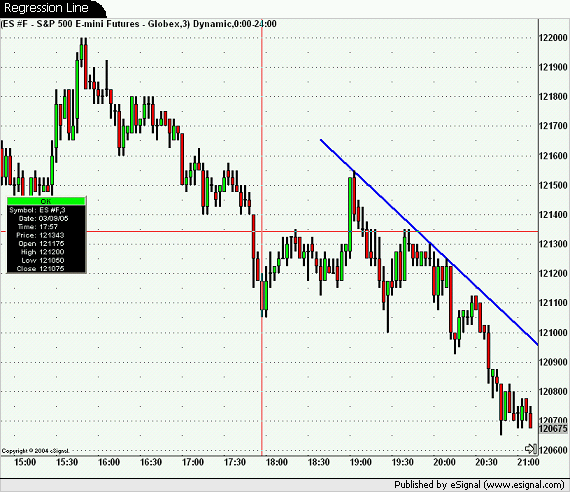
    is it possible to write a efs which will draw a regression line at the highs of the previos user defined bars (say 40), see picture below,

    i have tried to modify linear regression but to no avail ,does anybody have any ideas how i would go about it,
  • #2
    Hello Shogun,

    Below is a linear regression function you can use to get the slope and intercept from any array of prices you pass to it. nLRlen (periods for regression) could also be taken out of the the parameters and set to the ".length" property of the array inside the function. Once you have the slope (A) and intercept (B) you can use the following drawLine function to draw the regression line.

    drawLineRelative(0, B, -(nLRlen-1), (A*(nLRlen-1)) + B, PS_SOLID, 2, Color.blue, "RegLine");

    PHP Code:
    function LinReg(nLRlenaArray) {
        var 
    xSum 0;
        var 
    ySum 0;
        
    0;
        for (
    0nLRlen; ++i) {
            
    xSum += i;
            
    ySum += aArray[i];
        }
        var 
    xAvg xSum/nLRlen;
        var 
    yAvg ySum/nLRlen;
        var 
    aSum1 0;
        var 
    aSum2 0;
        
    0;
        for (
    0nLRlen; ++i) {
            
    aSum1 += (i-xAvg) * (aArray[i]-yAvg); 
            
    aSum2 += (i-xAvg)*(i-xAvg);
        }
        var 
    = (aSum1 aSum2);    // Slope
        
    var yAvg - (A*xAvg);    // Y - Intercept
        
        
    return new Array(AB);

    The image you posted doesn't look to be where the regression line would be for the last 40 bars' highs. It should have roughly half of the high prices above and below the regression line. What you could do to get closer to the line in your image would be to draw the +1 standard deviation regression line. Maybe both a +1 and +2 stdev lines. Below is another function that will give you the standard deviation from the same price array. Here's what the drawLine function would look like to draw the +2 stdev line.

    drawLineRelative(0, B + (2*stdev), -(nLRlen-1), (A*(nLRlen-1)) + B + (2*stdev), PS_SOLID, 2, Color.blue, "RegLine2");

    PHP Code:
    function StDev(aArray) {    
        var 
    nLength aArray.length;
        var 
    sumX 0;
        var 
    sumX2 0;
        if (
    aArray == null) return;
        
        for (
    0nLength; ++i) {
            
    sumX += aArray[i];
            
    sumX2 += (aArray[i] * aArray[i])
        }
        var 
    meanX = (sumX/nLength);
        var 
    stdev Math.sqrt((sumX2/nLength) - (meanX*meanX));

        return 
    stdev;

    Jason K.
    Project Manager
    eSignal - an Interactive Data company

    EFS KnowledgeBase
    JavaScript for EFS Video Series
    EFS Beginner Tutorial Series
    EFS Glossary
    Custom EFS Development Policy

    New User Orientation

    Comment


    • #3
      thanks Jason
      your ideas on using the standard deviation lines instead of the actual regression line should solve the problem near enough for what i am after.

      Comment


      • #4
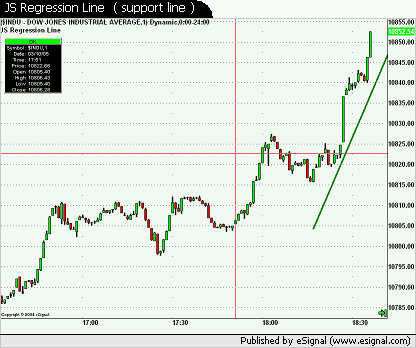
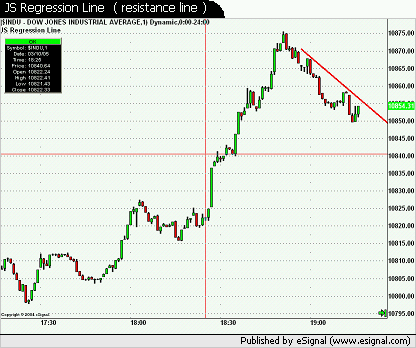
        All seems to work as i required see images below, but i had a problem with the "addLineTool" on the current line not refreshing, so i have to use the remove LineTool with every tick , this has not given me any problems but i am wondering if this is a valid way of using the LineTool or am i better using the "drawLineRelative"

        see code below.

        PHP Code:
        if ( B2 >  (A2*(js-1)) + B2){ // to color the bars in direction of move.
                    
        removeLineTool(LineTool.RAY,"Upr1");
                    
        removeLineTool(LineTool.RAY,"Lwr1");
                    
        addLineTool(LineTool.RAY, -(js-1), (A2*(js-1)) + B2 - (nLRstdev1*vStDev), 
                    
        0B2 - (nLRstdev1*vStDev), 3Color.green"Lwr1");
                    }else {
                    
        removeLineTool(LineTool.RAY,"Lwr1");
                    
        removeLineTool(LineTool.RAY,"Upr1");
                    
        addLineTool(LineTool.RAY, -(js-1), (A2*(js-1)) + B2 + (nLRstdev1*vStDev), 
                    
        0B2 + (nLRstdev1*vStDev), 3Color.red"Upr1");
                    } 


        Comment


        • #5
          shogun
          You do need to remove the Line Tools at every tick. You may want to try using clearLineTool(LineTool.RAY) which will clear all line tools
          Alex

          Comment


          • #6
            Thanks Alexis
            i have changed the code and will see how it works,

            Comment


            • #7
              Hi Shogun

              This looks like a great EFS, would you please post it when it is done, I know nothing about programing but appreciate your time and efforts. Thank you in advance for anything you may post,
              Kindest Regards
              Mark

              Comment


              • #8
                its1111
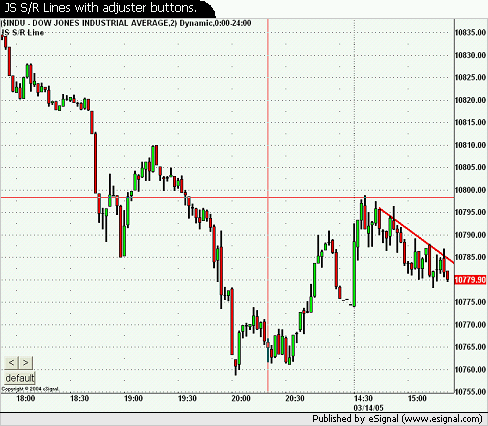
                finally got round to finishing the efs , because it is based on linear regression the lines are not true support / resistance lines so as a work around i have added two adjusting buttons so you can get the lines to fit different instruments there is also a default button to return to the original settings, see below .


                Attached Files

                Comment


                • #9
                  Shogun

                  I have to tell you that this EFS is truly amazing. I have looked for something like this for a long time. Thank you very much.
                  I have tried other trend line EFS and they sort of worked, but yours is exceptional. Thank you very much for sharing it.
                  Mark

                  Comment


                  • #10
                    Thanks Mark,
                    i will be adding alerts to it at some time in the future and hopefully make it so it will self adjust to the chart ,

                    Comment


                    • #11
                      take a look at this efs.....moving linreg channels

                      Peter
                      Attached Files

                      Comment


                      • #12
                        if you add the following to the first line of function main it will speed up the efs when loading and using the adjusting buttons,

                        PHP Code:
                        if (getCurrentBarIndex() < -lineLength) return; 

                        luvette
                        thanks i have seen that efs but it was no exactly what i was after.

                        Comment


                        • #13
                          excellent efs

                          Shogun-

                          Nicely done! Is there a way to reference the last plotted point of the line so as to compare it to the close? Also, have you tried to write a similar efs that looks at the last xnumber of bars' highs to plot a line that is not penetrated along its length?

                          Comment

                          Working...
                          X