Announcement

Collapse
No announcement yet.

New EFS2 functions - efsExternal() and efsInternal()

Collapse
This topic is closed.
X
X
 
  • Filter
  • Time
  • Show
Clear All
new posts

  • ACM
    replied
    efsInternal() (enhanced functionality)

    (continues from prior post – to see the thread in reverse order click here)

    In version 7.9.1 the efsInternal() function has been enhanced and now includes the same functionality of the efsExternal() function described in the prior post
    To see how it works save the script enclosed below as test3.efs
    Alex

    PHP Code:
    function preMain() {
        
    setPriceStudy(false);
        
    setStudyTitle("MACD");
        
    setCursorLabelName("MACD",0);
        
    setCursorLabelName("MACDSig",1);
        
    setCursorLabelName("MACDHist",2);
        
    setDefaultBarFgColor(Color.blue,0); 
        
    setDefaultBarFgColor(Color.red,1);
        
    setDefaultBarFgColor(Color.magenta,2); 
        
    setPlotType(PLOTTYPE_LINE,0);
        
    setPlotType(PLOTTYPE_LINE,1);
        
    setPlotType(PLOTTYPE_HISTOGRAM,2); 
    }

    function 
    main(){

        var 
    vExtEfs efsInternal("example");
        
        var 
    vMACD getSeries(vExtEfs,0);
        var 
    vSig  getSeries(vExtEfs,1);
        var 
    vHist  getSeries(vExtEfs,2);

        return new Array (
    vMACD,vSig,vHist.getValue(0));
    }

    function 
    example(){

        return new Array (
    macd(12,26,9), macdSignal(12,26,9), macdHist(12,26,9));

    Note: All the examples provided in this thread are primarily intended to illustrate in the simplest possible way the functionality and the basic construct of these new EFS2 functions and are not necessarily written in the most efficient way
    If you search through the forums you will find many threads [complete with examples] that discuss how to use them efficiently
    Leave a comment:


  • ACM
    replied
    efsExternal() (new function)

    (continues from prior post – to see the thread in reverse order click here)

    A new function called efsExternal() has been added in version 7.9.1.
    This function is essentially a replacement of the efs() function explained earlier in this thread [which will probably be deprecated] in as much as it retrieves the values from an external efs and converts those to a series. There are however two distinct differences one being the required syntax and the other its functionality.
    Series index is no longer a required parameter and the function can now also retrieve an array from the external efs. With efs() instead the function could only retrieve one element of the return array as indicated by the series index parameter.
    The syntax for the new efsExternal() function is as follows

    efsExternal("efsname.efs" [, parameter1] [, parameter2] [, etc])

    Note that the square brackets indicate that these are optional parameters to be passed to the external efs if it requires them.

    Once you have retrieved the array from the external efs you then use the getSeries() function to retrieve the individual elements of the array. See the following example that assumes that the external efs is returning three elements (like a MACD for example)

    PHP Code:
    var myVar efsExternal("myEFS.efs" <parameters if required>);//this calls the external efs
                                                                  //and retrieves the array

    var myRet1 getSeries(myVar); // retrieves the first element of the array and creates the series
                                 //can also be written as getSeries(myVar,0)
    var myRet2 getSeries(myVar,1);//retrieves the second element and creates the series
    var myRet3 getSeries(myVar,2);//retrieves the third element and creates the series 
    At this point the variable myRet1, myRet2 and myRet3 are in all effects series and can be plotted, used as inputs to other studies requiring a series.
    As with any series you can also retrieve the individial values using the getValue() method ie myRet.getValue(0) etc.

    To see how all this works save the script enclosed below as test1.efs.

    PHP Code:
    function preMain() {
        
    setPriceStudy(false);
        
    setStudyTitle("test1");
        
    setCursorLabelName("MACD",0);
        
    setCursorLabelName("MACDSig",1);
        
    setCursorLabelName("MACDHist",2);
        
    setDefaultBarFgColor(Color.blue,0); 
        
    setDefaultBarFgColor(Color.red,1);
        
    setDefaultBarFgColor(Color.magenta,2); 
        
    setPlotType(PLOTTYPE_LINE,0);
        
    setPlotType(PLOTTYPE_LINE,1);
        
    setPlotType(PLOTTYPE_HISTOGRAM,2); 
    }

    function 
    main(){

        return new Array (
    macd(12,26,9), macdSignal(12,26,9), macdHist(12,26,9));

    Now save the following script as test2.efs in the same folder

    PHP Code:
    function preMain() {
        
    setPriceStudy(false);
        
    setStudyTitle("MACD");
        
    setCursorLabelName("MACD",0);
        
    setCursorLabelName("MACDSig",1);
        
    setCursorLabelName("MACDHist",2);
        
    setDefaultBarFgColor(Color.blue,0); 
        
    setDefaultBarFgColor(Color.red,1);
        
    setDefaultBarFgColor(Color.magenta,2); 
        
    setPlotType(PLOTTYPE_LINE,0);
        
    setPlotType(PLOTTYPE_LINE,1);
        
    setPlotType(PLOTTYPE_HISTOGRAM,2); 
    }

    function 
    main(){

        var 
    vExtEfs efsExternal("test1.efs");
        
        var 
    vMACD getSeries(vExtEfs,0);
        var 
    vSig  getSeries(vExtEfs,1);
        var 
    vHist getSeries(vExtEfs,2);

        return new Array (
    vMACD,vSig,vHist.getValue(0));

    Note that in the return statement I have included both a series and a value just to show that it can be done either way.
    As you can see with a single efsExternal() call we are now retrieving the array from the external efs whereas with the prior efs() function we would have had to make three separate efs() calls.
    Alex

    Leave a comment:


  • ACM
    replied
    (continues from prior post – to see the thread in reverse order click here)

    NOTE OF INTEREST: In order to appreciate to what length eSignal has gone to ensure that EFS2 is backwards compatible and at the same time to understand how deep and far reaching is the control exercised by the new EFS2 engine, I would like to show how a standard EFS1 builtin study is also capable of running on multiple intervals when used in the context of the new functions available in EFS2.
    The following example was created using the builtin MACD study available in the Builtin folder.

    PHP Code:
    var fpArray = new Array();

    function 
    preMain() {

        
    setStudyTitle("MACD");
        
    setCursorLabelName("MACD",0);
        
    setCursorLabelName("MACDSig",1);
        
    setCursorLabelName("MACDHist",2);
        
    setDefaultBarFgColor(Color.blue,0); 
        
    setDefaultBarFgColor(Color.red,1);
        
    setDefaultBarFgColor(Color.magenta,2); 
        
    setPlotType(PLOTTYPE_LINE,0);
        
    setPlotType(PLOTTYPE_LINE,1);
        
    setPlotType(PLOTTYPE_HISTOGRAM,2); 
        
    setDefaultBarThickness(1,0);
        
    setDefaultBarThickness(1,1);
        
    setDefaultBarThickness(1,2);
        
    askForInput();
        
        var 
    x=0;
        
    fpArray[x] = new FunctionParameter("Fast"FunctionParameter.NUMBER);
        
    with(fpArray[x++]){
            
    setLowerLimit(1);        
            
    setDefault(12);
        }
        
    fpArray[x] = new FunctionParameter("Slow"FunctionParameter.NUMBER);
        
    with(fpArray[x++]){
            
    setLowerLimit(1);        
            
    setDefault(26);
        }
        
    fpArray[x] = new FunctionParameter("Smoothing"FunctionParameter.NUMBER);
        
    with(fpArray[x++]){
            
    setLowerLimit(1);        
            
    setDefault(9);
        }
        
    fpArray[x] = new FunctionParameter("Source"FunctionParameter.STRING);
        
    with(fpArray[x++]){
            
    addOption("Open"); 
            
    addOption("High");
            
    addOption("Low");
            
    addOption("Close");
            
    setDefault("Close"); 
        }
        
    fpArray[x] = new FunctionParameter("Symbol"FunctionParameter.STRING);
        
    with(fpArray[x++]){
            
    setDefault("");
        }
        
    fpArray[x] = new FunctionParameter("Interval"FunctionParameter.NUMBER);
        
    with(fpArray[x++]){
            
    setDefault("");
        }
    }

    var 
    bInit false;
    var 
    vSymbol null;

    function 
    main(Fast,Slow,Smoothing,Source,Symbol,Interval){

        if(
    bInit == false){
            
    addBand(0,PS_SOLID,1,Color.black,"Centerline");
            if(
    Symbol == nullSymbol getSymbol();
            if(
    Interval == nullInterval getInterval();
            
    vSymbol Symbol+","+Interval;
            
    bInit true;
        }
     
        var 
    xMACD efsInternal("calcMACD",Fast,Slow,Smoothing,Source,sym(vSymbol));
        var 
    xSig efsInternal("calcSIG",Fast,Slow,Smoothing,Source,sym(vSymbol));
        
    //var xSig = sma(Smoothing,xMACD); //alternatively one could use this to create the Signal plot
        
    var xHist efsInternal("calcHIST",Fast,Slow,Smoothing,Source,sym(vSymbol));

        
        return new Array (
    xMACD,xSig,xHist);
    }

    var 
    vMACD null;

    function 
    calcMACD(fastslowsmoothingsourcesymbol){

        if(
    vMACD==nullvMACD = new MACDStudy(fastslow,smoothing,source,false,false);//EFS1 study

        
    return vMACD.getValue(MACDStudy.MACD);
    }

    var 
    vSIG=null;

    function 
    calcSIG(fastslowsmoothingsourcesymbol){

        if(
    vSIG==nullvSIG = new MACDStudy(fastslow,smoothing,source,false,false);//EFS1 study

        
    return vSIG.getValue(MACDStudy.SIGNAL);


    var 
    vHIST  null;
        
    function 
    calcHIST(fastslowsmoothingsourcesymbol){

        if(
    vHIST==nullvHIST = new MACDStudy(fastslow,smoothing,source,false,false);//EFS1 study

        
    return vHIST.getValue(MACDStudy.HIST);

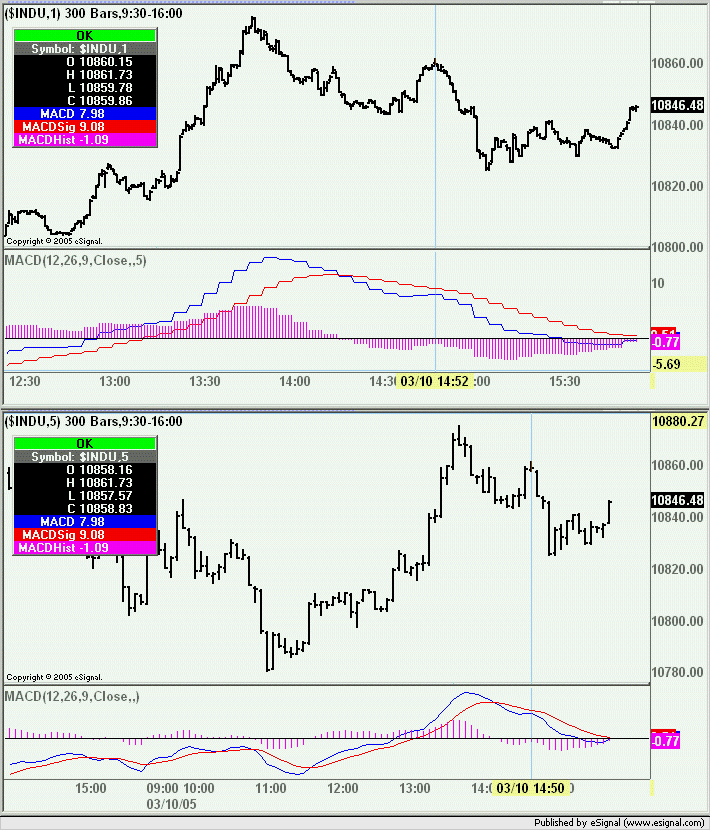
    Run the script and then set the Symbol and/or Interval parameters in Edit Studies to a symbol and/or interval that are different from the one being charted (preferably a higher interval as it makes for a more interesting effect). You will see that although the MACD study is the EFS1 version it will plot as if it were an EFS2 study even though it was never originally designed to do so (see image below).


    A compiled copy of these posts is also available as a Word or HTML document in the Docs folder of the eSignal application directory

    Leave a comment:


  • ACM
    replied
    (continues from prior post – to see the thread in reverse order click here)

    The syntax required by the efs() function is essentially identical to that used by efsInternal(). The only difference is that with efs() you also need to specify the series index irrespective of whether the external efs is returning only one element or an array.
    As an example assume we have an efs that calculates the range of a bar called HiLoRange.efs which is written as follows

    PHP Code:
    function preMain() {

        
    setStudyTitle("HiLoRange");
        
    setCursorLabelName("H-L"0);
        
    setPlotType(PLOTTYPE_HISTOGRAM0);
        
    setDefaultBarFgColor(Color.blue0);
    }

    function 
    main() {

        var 
    vRange high()-low();
       
        return 
    vRange;

    At this point we want to compute its ema. The calling efs would be written as follows. Notice that it is virtually identical to the examples shown in the prior post.
    (Note: save the file in the same folder as the called efs)

    PHP Code:
    function preMain() {

        
    setStudyTitle("EMA of High-Low");
        
    setCursorLabelName("H-L"0);
        
    setCursorLabelName("EMA"1);
        
    setPlotType(PLOTTYPE_HISTOGRAM0);
        
    setDefaultBarFgColor(Color.blue0);
        
    setDefaultBarFgColor(Color.red1);
        
        var 
    fp1 = new FunctionParameter("Length"FunctionParameter.NUMBER);
            
    fp1.setLowerLimit(1);
            
    fp1.setDefault(10);
    }

    function 
    main(Length) {

        var 
    nHL efs("HiLoRange.efs",0); //this calls the external efs “HiLoRange” and creates a series
        
    var vEMA ema(Length,,nHL); //the series is used as an input to a builtin study

        
    return new Array(nHLvEMA);

    If at this point we wanted to control also the context in which the external efs is executed thereby being able to use multiple symbols and/or intervals we would write the called efs as follows…

    PHP Code:
    function preMain() {

        
    setStudyTitle("HiLoRange");
        
    setCursorLabelName("H-L"0);
        
    setPlotType(PLOTTYPE_HISTOGRAM0);
        
    setDefaultBarFgColor(Color.blue0);
    }

    function 
    main(source) { //added parameter in main definition (see Note)

        
    var vRange high()-low();
       
        return 
    vRange;
    }

    //Note: The parameter in the main definition is not a requirement if
    //      only sym() or inv() are being passed but is good coding practice 
    …and the calling efs as follows

    PHP Code:
    function preMain() {

        
    setStudyTitle("EMA of High-Low");
        
    setCursorLabelName("H-L"0);
        
    setCursorLabelName("EMA"1);
        
    setPlotType(PLOTTYPE_HISTOGRAM0);
        
    setDefaultBarFgColor(Color.blue0);
        
    setDefaultBarFgColor(Color.red1);
        
        var 
    fp1 = new FunctionParameter("Length"FunctionParameter.NUMBER);
            
    fp1.setLowerLimit(1);
            
    fp1.setDefault(10);
            
        var 
    fp2 = new FunctionParameter("Interval"FunctionParameter.STRING);
            
    fp2.setDefault();
        
        var 
    fp3 = new FunctionParameter("Symbol"FunctionParameter.STRING);
            
    fp3.setDefault();
    }

    function 
    main(Length,Interval,Symbol) {

        if(
    Symbol == nullSymbol getSymbol();
        if(
    Interval == nullInterval getInterval();
        var 
    vSymbol Symbol+","+Interval;
        
        var 
    nHL efs("HiLoRange.efs",0,sym(vSymbol)); //this calls the external efs "HiLoRange" 
                                                               //passing Symbol/Interval and creates a series
        
    var vEMA ema(Length,nHL); //the series is used as an input to a builtin study 

        
    return new Array(nHLvEMA);


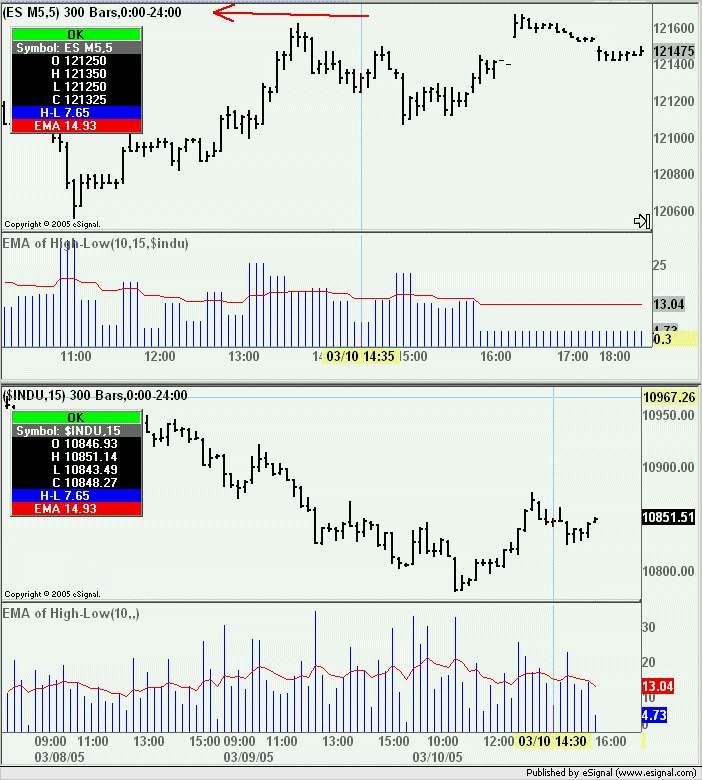
    In the following image you can see the plot of the efs using a symbol and interval different from the one being charted in the price pane (the bottom chart is shown for comparison purposes)
    Interesting to note that it is no longer necessary to “tailor” the Time Template to synchronize the external symbol. In EFS2 the formula engine takes care of that for us. In fact you can see that the plots are synchronized even though the Time Template is set to 24hr (see red arrow) and not to RTH as we would have to set it in EFS1


    Leave a comment:


  • ACM
    started a topic New EFS2 functions - efsExternal() and efsInternal()

    New EFS2 functions - efsExternal() and efsInternal()

    Although many think that the main focus of EFS2 is the ability to use multiple intervals or symbols that functionality is actually only a part of what constitutes this revision of the formula engine.

    A great deal of new functionality has been added to EFS2 that extends its capabilities well beyond multiple intervals or symbols. New functions such as efs() or efsInternal() for example now allow to pass custom variables to builtin studies while the Function Library can be used to create studies and indicators that behave like the builtins. Also creating studies on studies is now a very easy task irrespective of whether one is using builtin or user defined studies.

    In this document I will show some relatively basic examples of two of these new functions specifically efs() and efsInternal().
    For examples on Library Functions instead you may want to download dsFunctions.efsLib and dsUtilities.efsLib which are available here or amStudies.efsLib which is available here In both cases I would suggest downloading also the corresponding Help files or documentation available at the same links.

    efs() and efsInternal() are virtually identical functions the only difference being that efs() calls external studies while efsInternal() calls internal functions. Although similar in concept to call() and callFunction() they are much more powerful in as much as they allow to use the return from either an external efs or an internal function as the input to any builtin study (or study created using the Function Library).
    Also when a symbol or interval are passed to the called efs both efs() and efsInternal() control the context in which that efs or function is executed i.e. in what time frame and/or with what symbol that efs or function will run (even if that efs or function is not written using efs2 syntax - more on this later)
    Note however that, unlike call() or callFunction(), the efs() and efsInternal() functions will only retrieve values [returned by the called efs or function] that are numbers and not strings.

    As a first example let us assume that we want to calculate an exponential moving average of the price range (i.e. High-Low). As we cannot pass a user defined variable to an EFS1 builtin study this means that we would need to write our own exponential moving average.
    In EFS1 the required code would be as follows.

    PHP Code:
    function preMain() {

        
    setStudyTitle("EMA of High-Low");
        
    setCursorLabelName("H-L"0);
        
    setCursorLabelName("EMA"1);
        
    setPlotType(PLOTTYPE_HISTOGRAM0);
        
    setDefaultBarFgColor(Color.blue0);
        
    setDefaultBarFgColor(Color.red1);
        
        var 
    fp1 = new FunctionParameter("Length"FunctionParameter.NUMBER);
            
    fp1.setLowerLimit(1);
            
    fp1.setDefault(10);
    }

    var 
    nHL null;
    var 
    nArray null;
    var 
    vEMA null;
    var 
    vEMA1 null;
    var 
    dPercent 0.0;
    var 
    bPrimed false;

    function 
    main(Length) {

        var 
    nState getBarState();
        
        if(
    nArray == nullnArray = new Array(Length);
        
        if (
    nState == BARSTATE_NEWBAR && nHL != null) {
            
    nArray.pop();
            
    nArray.unshift(nHL);
        }
        
        
    nHL high(0) - low(0);
        
    nArray[0] = nHL;
        
        if (
    nArray[Length-1] == null) return;
        
        
    vEMA EMA(LengthnArray);
        
        return new Array(
    nHLvEMA);
    }

    function 
    EMA(LengthnArray) {

        var 
    nBarState getBarState();
        var 
    dSum 0.0;

        if(
    nBarState == BARSTATE_ALLBARS || bPrimed == false) {
            
    dPercent = (2.0 / (Length 1.0));
            
    bPrimed false;
        }

        if (
    nBarState == BARSTATE_NEWBAR) {
            
    vEMA1 vEMA;
        }

        if(
    bPrimed == false) {
            for(
    0Lengthi++) {
                
    dSum += nArray[i];
            }
            
    bPrimed true;
            return (
    dSum Length);
        } else {
            return (((
    nArray[0] - vEMA1) * dPercent) + vEMA1);
        }

    In EFS2 instead all we need to do is write a separate function to calculate the range and then create a variable that uses efsInternal() to retrieve the value returned by that function. Since the variable is now treated as a series by the EFS2 engine (rather than being a single value) we can use that variable directly as an input of the builtin study i.e. ema(). Following is the equivalent EFS2 code with comments

    PHP Code:
    function preMain() {

        
    setStudyTitle("EMA of High-Low");
        
    setCursorLabelName("H-L"0);
        
    setCursorLabelName("EMA"1);
        
    setPlotType(PLOTTYPE_HISTOGRAM0);
        
    setDefaultBarFgColor(Color.blue0);
        
    setDefaultBarFgColor(Color.red1);
        
        var 
    fp1 = new FunctionParameter("Length"FunctionParameter.NUMBER);
            
    fp1.setLowerLimit(1);
            
    fp1.setDefault(10);
    }

    function 
    main(Length) {
        
        var 
    nHL efsInternal("range"); //this line calls the function "range" and creates a series
        
    var vEMA ema(Length,nHL); //the series is used as an input to the builtin study

        
    return new Array(nHLvEMA);
    }
    //this is the separate function that calculates the range
    function range() {

        return (
    high(0)-low(0)); //calculate the range

    Aside from being a lot easier to write the difference in the required code is staggering. This disparity becomes even greater if for example we want to create a double exponential moving average of the range.
    In EFS1 the code would be:

    PHP Code:
    function preMain() {

        
    setStudyTitle("EMA of EMA of High-Low");
        
    setCursorLabelName("H-L"0);
        
    setCursorLabelName("EMA"1);
        
    setPlotType(PLOTTYPE_HISTOGRAM0);
        
    setDefaultBarFgColor(Color.blue0);
        
    setDefaultBarFgColor(Color.red1);
        
        var 
    fp1 = new FunctionParameter("Length"FunctionParameter.NUMBER);
            
    fp1.setLowerLimit(1);
            
    fp1.setDefault(10);

        var 
    fp2 = new FunctionParameter("Length2"FunctionParameter.NUMBER);
            
    fp2.setLowerLimit(1);
            
    fp2.setDefault(10);
    }

    var 
    nHL null;
    var 
    nArray null;
    var 
    nArray2 null;
    var 
    vEMA = new Array(2);
        
    vEMA[0] = null;
        
    vEMA[1] = null;
    var 
    vEMA1 = new Array(2);
        
    vEMA1[0] = null;
        
    vEMA1[1] = null;

    var 
    dPercent = new Array(2);
        
    dPercent[0] = 0.0;
        
    dPercent[1] = 0.0;
    var 
    bPrimed = new Array(2);
        
    bPrimed[0] = false;
        
    bPrimed[1] = false;

    function 
    main(LengthLength2) {

        var 
    nState getBarState();
        
        if(
    nArray == nullnArray = new Array(Length);
        if(
    nArray2 == nullnArray2 = new Array(Length2);
        
        if (
    nState == BARSTATE_NEWBAR) {
            if (
    nHL != null) {
                
    nArray.pop();
                
    nArray.unshift(nHL);
            }
            if (
    vEMA[0] != null) {
                
    nArray2.pop();
                
    nArray2.unshift(vEMA[0]);
            }
        }
        
        
    nHL high(0) - low(0);
        
    nArray[0] = nHL;
        
        if (
    nArray[Length-1] == null) return;
        
        
    vEMA[0] = EMA(0LengthnArray);
        
    nArray2[0] = vEMA[0];
        
        if (
    nArray2[Length2-1] != null) {
            
    vEMA[1] = EMA(1Length2nArray2);
        }
        
        return new Array(
    nHLvEMA[1]);
    }

    function 
    EMA(numLength, Array) {

        var 
    nBarState getBarState();
        var 
    dSum 0.0;

        if(
    nBarState == BARSTATE_ALLBARS || bPrimed[num] == false) {
            
    dPercent[num] = (2.0 / (Length 1.0));
            
    bPrimed[num] = false;
        }

        if (
    nBarState == BARSTATE_NEWBAR) {
            
    vEMA1[num] = vEMA[num];
        }

        if(
    bPrimed[num] == false) {
            for(
    0Lengthi++) {
                
    dSum += Array[i];
            }
            
    bPrimed[num] = true;
            return (
    dSum Length);
        } else {
            return (((Array[
    0] - vEMA1[num]) * dPercent[num]) + vEMA1[num]);
        }

    It becomes immediately apparent that the formula is exponentially more complex and quite difficult to code for anyone other than a user who is proficient with the language. With EFS2 instead it only takes nesting a second ema() inside the first one as in the following example

    PHP Code:
    function preMain() {

        
    setStudyTitle("EMA of EMA of High-Low");
        
    setCursorLabelName("H-L"0);
        
    setCursorLabelName("EMA"1);
        
    setPlotType(PLOTTYPE_HISTOGRAM0);
        
    setDefaultBarFgColor(Color.blue0);
        
    setDefaultBarFgColor(Color.red1);
        
        var 
    fp1 = new FunctionParameter("Length"FunctionParameter.NUMBER);
            
    fp1.setLowerLimit(1);
            
    fp1.setDefault(10);

        var 
    fp2 = new FunctionParameter("Length2"FunctionParameter.NUMBER);
            
    fp2.setLowerLimit(1);
            
    fp2.setDefault(10);
    }

    function 
    main(Length,Length2) {
        
        var 
    nHL efsInternal("range"); //this calls the function "range" and creates a series
        
    var vEMA ema(Length,ema(Length2,nHL)); //the series is used as an input to the builtin study 
                                                 //which is nested in another builtin study
        
    return new Array(nHLvEMA);
    }
    //this is the separate function that calculates the range
    function range() {

        return (
    high(0)-low(0));

    Up to this point the functionality of the two scripts is essentially the same i.e. they both execute in the same time frame and using the same symbol plotted in the chart. The only difference - and not a small one - is that the EFS2 version is considerably easier to code than the EFS1 counterpart.

    If we now wanted to add to the EFS1 script the ability to compute across multiple intervals we would probably need at least an additional 300 lines of very complex code and even then the formula would likely have some limitations in the functionality. Regardless it would require very advanced programming skills to accomplish this task.

    With EFS2 instead all it takes is to pass a Sym/Inv series (see the EFS2 Help files for information on these functions) to the separate function so as to allow the formula engine to take control of that function and to make it execute in the desired symbol or interval context.
    Here is the same EFS2 code with the additional functionality to allow running the efs on multiple intervals and/or on a symbol that is different from the one being charted.

    PHP Code:
    function preMain() {

        
    setStudyTitle("EMA of EMA of High-Low");
        
    setCursorLabelName("H-L"0);
        
    setCursorLabelName("EMA"1);
        
    setPlotType(PLOTTYPE_HISTOGRAM0);
        
    setDefaultBarFgColor(Color.blue0);
        
    setDefaultBarFgColor(Color.red1);
        
        var 
    fp1 = new FunctionParameter("Length"FunctionParameter.NUMBER);
            
    fp1.setLowerLimit(1);
            
    fp1.setDefault(10);

        var 
    fp2 = new FunctionParameter("Length2"FunctionParameter.NUMBER);
            
    fp2.setLowerLimit(1);
            
    fp2.setDefault(10);
    }

    function 
    main(Length,Length2,Interval,Symbol) {

        if(
    Symbol == nullSymbol getSymbol();
        if(
    Interval == nullInterval getInterval();
        var 
    vSymbol Symbol+","+Interval;
        
        var 
    nHL efsInternal("range",sym(vSymbol)); //this calls the function "range" passing 
                                                     //a Symbol/Interval and creates a series
        
    var vEMA ema(Length,ema(Length2,nHL)); //the series is used as an input to a builtin study 
                                                 //which is nested in another builtin study

        
    return new Array(nHLvEMA);
    }
    //this is the separate function that calculates the range
    function range(source) {

        return (
    high(0)-low(0));

    As you can see other than the three lines of code required to create the user defined variable we only needed to add the Sym series that is being passed to the external function. A far cry from what would otherwise be required in EFS1 and a task that is within the reach of everyone.

    IMPORTANT NOTE: In order for the EFS2 engine to be able to control the context in which an external efs or a separate function execute (in other words in what time frame or with what symbol they will be running) the Sym/Inv series must be the last parameter passed by the efs() or efsInternal() functions
Working...
X