Robert Krausz Fibonacci Zones
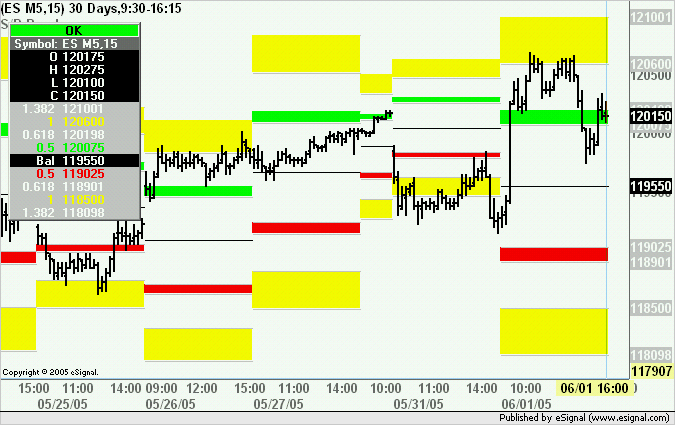
The attached efs computes the Fib Zones as defined by Robert Krausz in a TAS&C interview published in 1998.
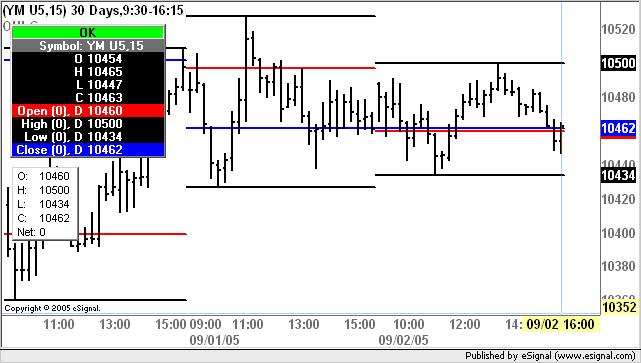
The efs computes the range of a "higher" interval (defaults are Daily for intraday and Weekly for daily charts) and multiplies that by user defined Fibonacci values (defaults are 0.500, 0.618, 1.000, 1.382). It then adds/subtracts the resulting values to the Balance Line (ie the average of the range plus the prior close of the higher interval) thereby creating projected zones of support/resistance and paints the backgrounds of these zones.
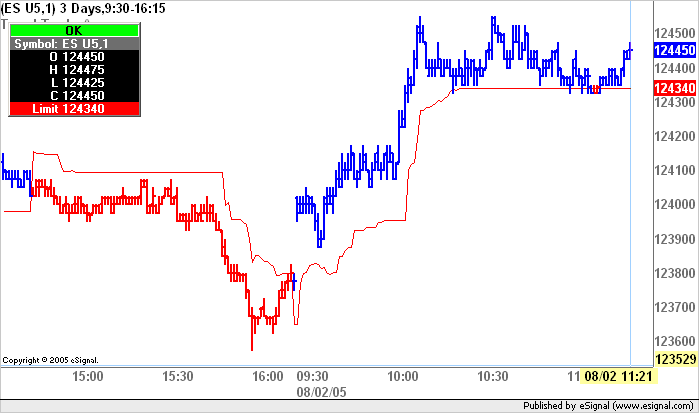
User defined settings include Interval, the Fibonacci multipliers and whether the background color is on or off. As an aside this efs can be used as an example of how to paint the background of a bar with multiple colors using the setBarBgColor() function with the optional yMin and yMax parameters.
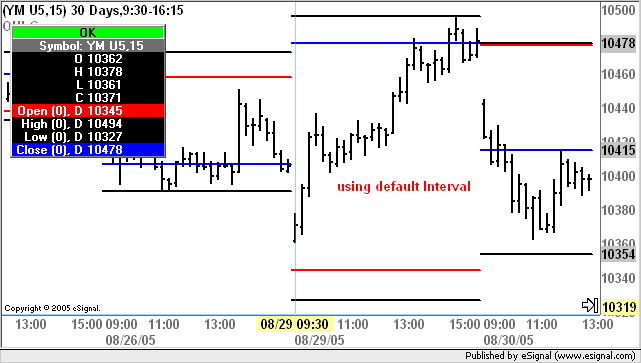
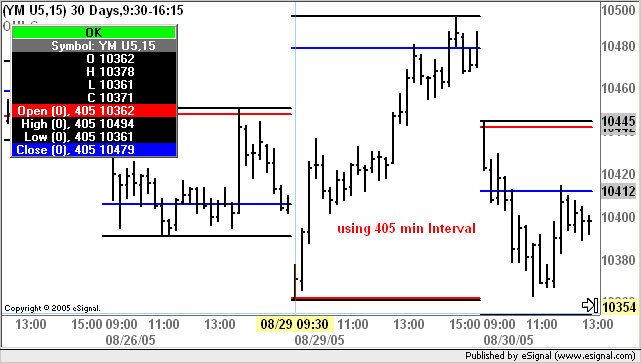
The efs can be run on any chart and the projected zones can be based on any interval.
Copy [or updated version] of the efs is also available here
Alex


Comment