Announcement

Collapse
No announcement yet.

Tick Bar Time Counter

Collapse
X
 
  • Filter
  • Time
  • Show
Clear All
new posts

  • #16
    Hello TBond,

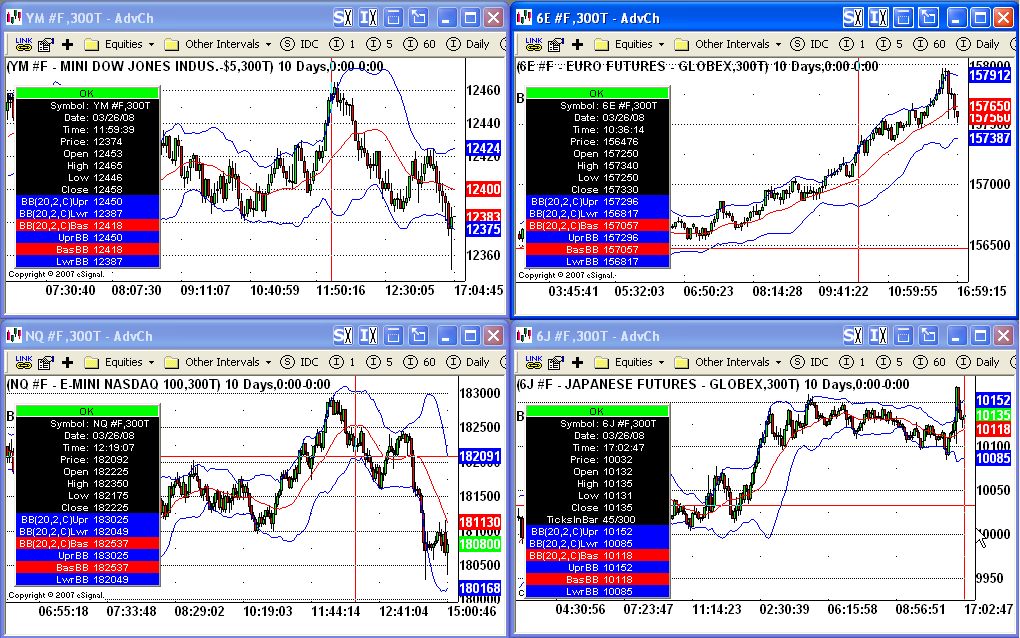
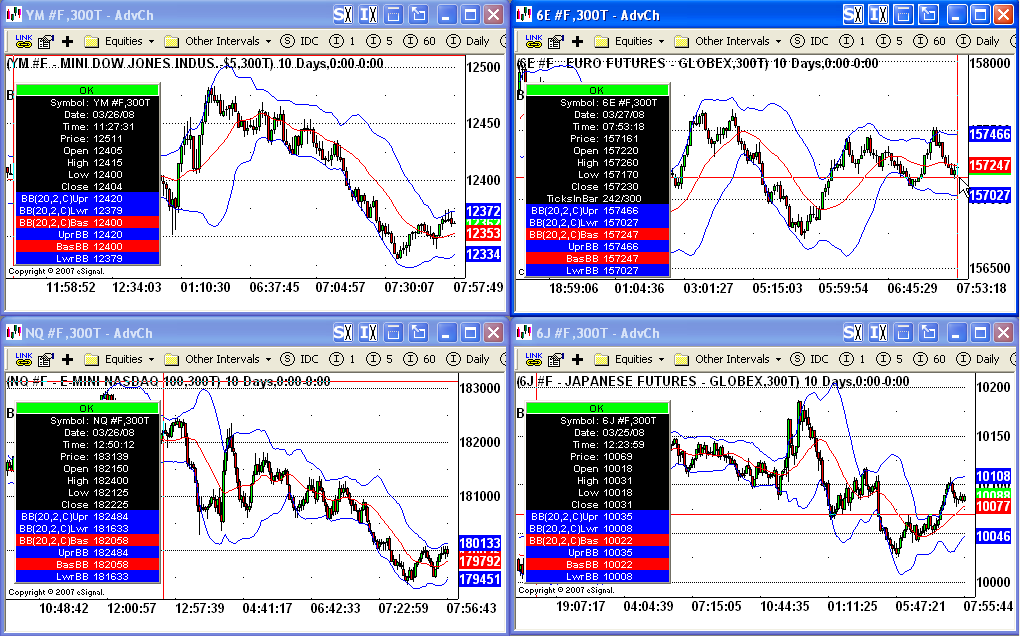
    I tested this overnight and did not see any drift this morning. I used a 24-hour time template on YM #F, 300T. That doesn't mean it is not happening. I'll continue to test this next week as well. In the mean time, please provide the specific information I requested for items 1 and 2 in my previous post. It is important that I have this information in order to test the exact same scenario you are experiencing the drift with.
    Jason K.
    Project Manager
    eSignal - an Interactive Data company

    EFS KnowledgeBase
    JavaScript for EFS Video Series
    EFS Beginner Tutorial Series
    EFS Glossary
    Custom EFS Development Policy

    New User Orientation

    Comment


    • #17
      1. What are the specific time template settings you are using with YM #F?

      2. What options are checked/unchecked in the Study Properties window for the Line/Tick chart type (right-click Edit Studies).

      425T YM #F;

      Channels Display checked, basis not checked.

      Comment


      • #18
        Hello TBond,

        I'm still looking into your drift scenario. So far, I still haven't seen the basic studies BB (20, 2.5, C) drift. The following images for YM #F, 425T were running on a 24-hour dynamic time template.


        The date in the above is a typo. It should read 3/6.


        Jason K.
        Project Manager
        eSignal - an Interactive Data company

        EFS KnowledgeBase
        JavaScript for EFS Video Series
        EFS Beginner Tutorial Series
        EFS Glossary
        Custom EFS Development Policy

        New User Orientation

        Comment


        • #19
          Jason,

          Here is example of drift as of 0850ET Friday 03.09.07
          Attached Files

          Comment


          • #20
            The drift on same chart as of 1420ET Friday 03.09.07:
            Attached Files

            Comment


            • #21
              Hello TBond,

              Thank you for posting the chart images. However, I still have not been able to reproduce the drift. I will continue to investigate. If you have any other information that may help reproduce this drift, please let me know.

              In the mean time, is the specific chart you use for YM #F always set to that symbol? In other words, do you ever change that specific chart's symbol to any others?

              Also, has that specific chart been in your page/layout for a long time? If that chart file was created when you were running an older version and has remained in your page/layout through a number of upgrades, this may possibly be the source of the problem. However, I'm not certain since you've stated that it is only occurring on YM #F.
              Jason K.
              Project Manager
              eSignal - an Interactive Data company

              EFS KnowledgeBase
              JavaScript for EFS Video Series
              EFS Beginner Tutorial Series
              EFS Glossary
              Custom EFS Development Policy

              New User Orientation

              Comment


              • #22
                >In the mean time, is the specific chart you use for YM #F always set to that symbol?
                yes, always YM #F

                >Also, has that specific chart been in your page/layout for a long time?
                several months but I've used that chart to create an identical one for NQ #F and I don't get the drift on the NQ #F chart

                Is it possible it's a server problem specific to me? Recall that I mentioned once the drift occurs, if I close the YM tick chart and reopen it, no data will load. Even if I create a new tick chart and apply YM #F as symbol, there will be not data (I've tried clicking the staus window in the chart as well with no success). Once I close the chart, the only way to get it to work is completely shutdown eSignal and restart it.

                Comment


                • #23
                  Hello TBond,

                  Regarding your data issue, this is most likely a connection issue between you and the server farm. The connection issue would not be the cause of the drift, however. The restart of eSignal bringing back the data is an indication that you've reconnected properly or to a different server. If you continue to have the connection issue I would recommend calling in to technical support to have them trouble shoot your specific connections.
                  Jason K.
                  Project Manager
                  eSignal - an Interactive Data company

                  EFS KnowledgeBase
                  JavaScript for EFS Video Series
                  EFS Beginner Tutorial Series
                  EFS Glossary
                  Custom EFS Development Policy

                  New User Orientation

                  Comment


                  • #24
                    The Bollinger Band drift is back!

                    I've gone almost an entire year without the problem recurring. In the past few weeks however, data has slowed (I have another feed I cross check with) and the Bollinger Band drift problem is back. This time however, the drift problem occurs on ALL tick charts I watch, not just YM as last year. I have tick charts on NQ, 6J, 6E and 6B that I watch. If I reload eSignal charts, they are fine during the day and then the next morning the shift is back.

                    To say this is frustrating is an understatement at best. I have been an eSignal subscriber for 15 years and I am really starting to be annoyed by this issue as well as the slow data.

                    I assure you I have changed nothing on the PC since last year before the problems started again (last year wasn't the 1st occurrence). I have an Intel Duo2 6600 2.4Ghz with 4Gig of memory installed and am running eSignal version 8.0 (build 782).

                    I am becoming one disgruntled LONGTIME customer!!!!!

                    Comment


                    • #25
                      Hello TBond,

                      Regarding the indicator drift, there is one known scenario that we've been able to reproduce that results in the drift on a Line/Tick chart type.

                      The drift occurs if all of the options for Bid Ask display in the Edit Studies dialog are unchecked.


                      These settings are unique to each chart that you have so check each chart and check all of these options. If you continue to experience a drift with all of these options enabled, please let us know.

                      This bug has been previously documented and our development group is aware of it. It has not yet been fixed, but we will try to get this into the 10.2 version.
                      Jason K.
                      Project Manager
                      eSignal - an Interactive Data company

                      EFS KnowledgeBase
                      JavaScript for EFS Video Series
                      EFS Beginner Tutorial Series
                      EFS Glossary
                      Custom EFS Development Policy

                      New User Orientation

                      Comment


                      • #26
                        I'm not using line/tick - i watching, e.g. 300T charts using cnadles and getting the drift - just like last year.

                        Comment


                        • #27
                          Hello TBond,

                          The last time this problem occurred on your end last year, the problem went away entirely until recently? Is that correct? Do you have any information regarding changes to chart settings or application preferences that you may have made at the time the problem stopped occurring?

                          At this point, you are the only user that I'm aware of that has encountered this particular drift scenario. One possibility is that you have found some rare combination of chart/application settings that are causing this drift for you. Another angle for us to explore is how you're specificially using the application that may be uncommon to typical usage. Please answer the following questions for starters.

                          1) Do you use Pages or Layouts?

                          2) How long do you allow the application to continue running without restarting eSignal?

                          3) How often do you reboot your PC?

                          4) The reason I asked about your Bid/Ask options for the Line/Tick chart settings is because that is one known area that is related to an indicator drift. I'm trying to find out if this is related even if your chart type is set to candlestick or bars. I would still like for you to check these settings and let me know if they are enabled or disabled for the charts you are seeing a drift on so that we can at least eliminate this as a possible cause.

                          I did a test for this drift last night using 10.0 (build 1086) where two of 4 charts had the bid/ask display options for the Line/Tick chart type disabled. However, none of the four charts showed a drift on my end (neither built-in BB or EFS). The bid/ask display options may not be the cause, but I'll continue to test for the drift using charts set both ways. I will also test using our current Beta for the 10.1 release.

                          These are the results from 10.0.1086.

                          3/26/08 apx 5pm PST


                          3/27/08 apx 8am PST
                          Jason K.
                          Project Manager
                          eSignal - an Interactive Data company

                          EFS KnowledgeBase
                          JavaScript for EFS Video Series
                          EFS Beginner Tutorial Series
                          EFS Glossary
                          Custom EFS Development Policy

                          New User Orientation

                          Comment

                          Working...
                          X