It is now very easy to write studies on studies in EFS2 irrespective of whether they are created using builtin or non builtin studies. In most cases it is actually even easier than using the Formula Wizard.
Here is a prime example of EFS2 code for a relatively common study ie the Stochastic of RSI (the same applies to Stoch of CCI or Stoch of Momentum, etc).
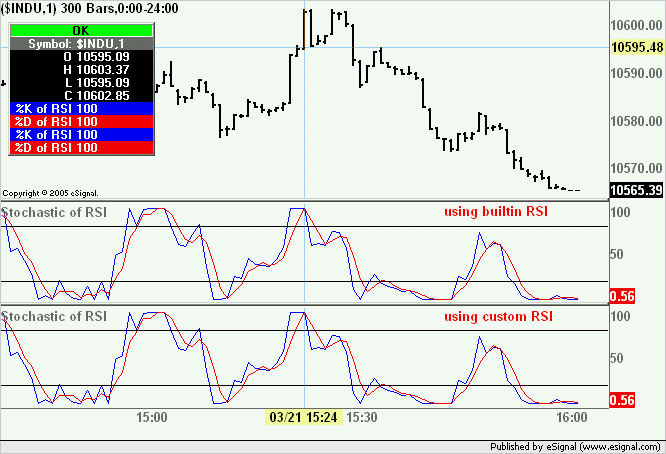
In the top pane of the following chart is the plot returned by the script shown above compared to that returned by the equivalent EFS1 code
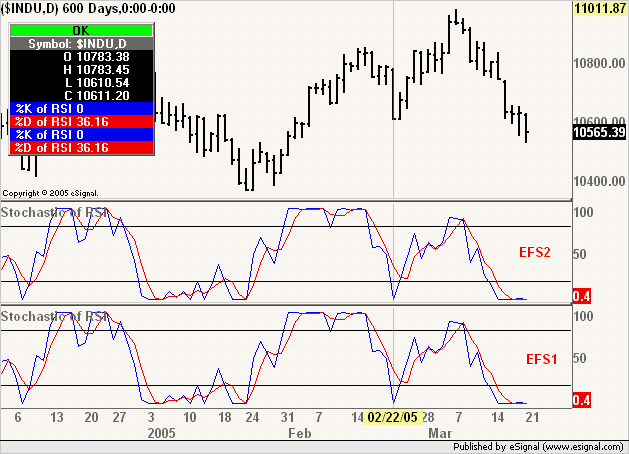
A fully customizable version of the efs (preset for use with multiple symbols/intervals) is attached and also available here
To run this study you need eSignal version 7.9 Beta 1 or later
Alex
As a note of interest here is the EFS1 code required to compute the same Stochastic of RSI.
I believe the difference speaks for itself.
Here is a prime example of EFS2 code for a relatively common study ie the Stochastic of RSI (the same applies to Stoch of CCI or Stoch of Momentum, etc).
PHP Code:
function preMain() {

    setStudyTitle("Stochastic of RSI ");

    setCursorLabelName("\%K of RSI", 0);

    setCursorLabelName("\%D of RSI", 1);

    setDefaultBarFgColor(Color.blue, 0);

    setDefaultBarFgColor(Color.red, 1);

    addBand(20, PS_SOLID, 1, Color.black);

    addBand(80, PS_SOLID, 1, Color.black);

    setStudyMax(105);

    setStudyMin(-5);

}


function main() {


    return new Array (stochK(14,1,3,rsi(14)),stochD(14,1,3,rsi(14)));

}

A fully customizable version of the efs (preset for use with multiple symbols/intervals) is attached and also available here
To run this study you need eSignal version 7.9 Beta 1 or later
Alex
As a note of interest here is the EFS1 code required to compute the same Stochastic of RSI.
I believe the difference speaks for itself.
PHP Code:
function preMain() {

    setStudyTitle("Stochastic of RSI ");

    setCursorLabelName("\%K of RSI", 0);

    setCursorLabelName("\%D of RSI", 1);

    setDefaultBarFgColor(Color.blue, 0);

    setDefaultBarFgColor(Color.red, 1);

    addBand(20, PS_SOLID, 1, Color.black);

    addBand(80, PS_SOLID, 1, Color.black);

    setStudyMax(105);

    setStudyMin(-5);

}


function HHrsi() {

    var hh = null;

    hh = aRSI[0];

    for(i = 0; i < 14; i++) {

        hh = Math.max(hh, aRSI[i]);

    }

    return hh;

}


function LLrsi() {

    var ll = null;

    ll = aRSI[0];;

    for(i = 0; i < 14; i++) {

        ll = Math.min(ll, aRSI[i]);

    }

    return ll;

}


var vStochRSI = null;


function StochK() {

    var nState = getBarState();

    var percentK;

    var vValue;

    var ll, hh;

    var sum = 0;


    ll = LLrsi(14)

    hh = HHrsi(14);


    if (nState == BARSTATE_NEWBAR && vStochRSI != null) {

        aStoch.pop();

        aStoch.unshift(vStochRSI);

    }


    vStochRSI = ((vRSI - ll) / (hh - ll)) * 100;

    aStoch[0] = vStochRSI;


    if (vSmooth == "true") {

        for(i = 0; i < 3; i++) {

            sum += aStoch[i];

        }

        sum /= 3;

        return sum;

    } else {

        return vStochRSI;

    }

}


function StochD() {

    var sum = 0;

    for(i = 0; i < 3; i++) {

       sum += aStochb[i];

    }

    sum = sum / 3;

    return sum;

}


var RSIstudy = null;

var aRSI = null;

var vRSI = null;

var aStoch = null;

var aStochb = null;

var vSmooth = "false";

var bEdit = true;

var vK = null;

var vD = null;


function main() {

    var nState = getBarState();


    if (bEdit == true || RSIstudy == null || aRSI == null || aStoch == null) {

        RSIstudy = new RSIStudy(14, "Close");

        aStoch = new Array(Math.max(1, 14));

        aStochb = new Array(3);

        aRSI = new Array(Math.max(14, 1));

        vSmooth = true;

        bEdit = false;

    }


    if (nState == BARSTATE_NEWBAR && vRSI != null) {

        aRSI.pop();

        aRSI.unshift(vRSI);

        aStochb.pop();

        aStochb.unshift(vK);

    }


    vRSI = RSIstudy.getValue(RSIStudy.RSI);

    if (vRSI == null) return;

    aRSI[0] = vRSI;


    vK = null;

    vD = null;


    var vLen = Math.max(14, 1);

    if (aRSI[vLen-1] != null) {

        vK = StochK(14, 14, 1);

        aStochb[0] = vK;

        vD = StochD(3);

    } else {

        return;

    }


    return new Array(vK, vD);

}
Comment