Announcement

Collapse
No announcement yet.

MA Xover help

Collapse
X
 
  • Filter
  • Time
  • Show
Clear All
new posts

  • MA Xover help

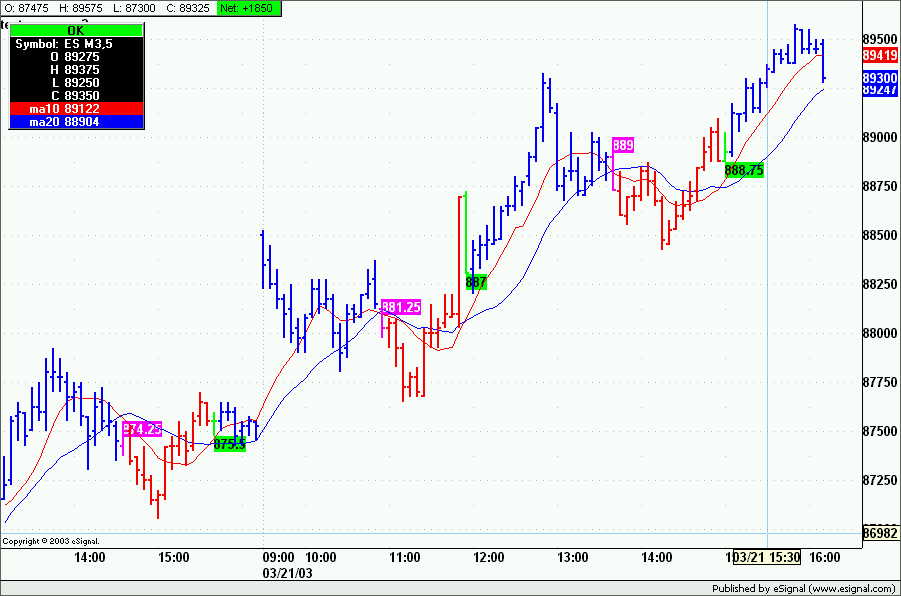
    Im trying to figure out how to make code for a moving average xover study. Thought it would be simple, but I cant get it to work.
    Example: when 9 day MA crosses up and closes over 18 day MA buy open of next bar. Exit and reverse when it crosses back.

    Was also thinking of an exit when price reaches SAR. This seemed an impossible task after seeing the trouble I had just trying to create a simple ma-xover study.
    Any help would be most appreciated.

    Thanks
    Eric

  • #2
    eric
    Attached efs might do what you want
    Alex

    Attached Files
    Last edited by ACM; 03-23-2003, 11:05 AM.

    Comment


    • #3
      eric
      In the formula the labels that show the entry price are incorrect.
      Substitute Line 93 with the following:

      if (vLastAlert != 1) drawTextRelative(1, low(), close(), Color.RGB(0,0,0), Color.RGB(0,255,0), Text.BOLD, "Arial", 12);

      and Line 104 with the following:

      if (vLastAlert != 2) drawTextRelative(1, high(), close(), Color.RGB(255,255,255), Color.RGB(255,0,255), Text.BOLD, "Arial", 12);

      This should put the correct price on the chart (I hope)

      Alex
      Last edited by ACM; 03-23-2003, 08:57 PM.

      Comment


      • #4
        Thanks much!!
        Works perfect. How would one go about backtesting this?
        Sorry for the trouble, but I'm brand new at this.
        Thanks again!

        Eric

        Comment


        • #5
          Eric
          Right click on the chart that has the data you want to use in backtesting (you could actually right click on any chart but for now better to keep things straight).
          Select Tools->Back Testing.
          This will open a window where you select the Symbol, Interval, Time Template (these three only if different from what is on the chart) and the Formula (ie strategy) you will be using.
          Then click Test.
          Alex

          Comment


          • #6
            Eric

            Lastly, if you want to see the entry prices at the top and bottom of the chart (as in the attached image) then substitute Line 93 and 104 in the formula with the following:

            if (vLastAlert != 1) drawTextRelative(1, 0, close(), Color.RGB(0,0,0), Color.RGB(0,255,0), Text.BOLD|Text.RELATIVETOBOTTOM, "Arial", 12);

            if (vLastAlert != 2) drawTextRelative(1, 0, close(), Color.RGB(255,255,255), Color.RGB(255,0,255), Text.BOLD|Text.RELATIVETOTOP, "Arial", 12);

            Alex
            Attached Files
            Last edited by ACM; 03-23-2003, 08:56 PM.

            Comment


            • #7
              Alex, thanks again for your help with this.
              I replaced the code as specified, and when I tried running it,
              I received an error stating: line 93: Parameter Number 3 of Function drawTextRelative is invalid.

              Eric

              Comment


              • #8
                Eric
                Sorry, I forgot that those lines only work on existing data (ie as if Back Testing) when written that way. In real time or in Replay that no longer holds true.
                I have gone back and corrected them in both messages so you can copy them again.
                What they now do is write on the chart the price of the Close of the bar on which the signal is generated which should be a realistic approximation of the Open of the bar that follows.
                However, in Back Testing it is still the Open of the bar following the one that generates the signal that is used as the entry price.
                Alex

                Comment

                Working...
                X