It is often requested that eSignal provide an =2 symbol for AB, YM and some other futures so that users can compute Pivots or other studies based only on the daily Highs and Lows of the RTH session. The main reason for the request is that in EFS1 it is not always an easy task to create these studies without the overnight data and although there are some solutions available - such as for example in this thread - they still have limitations.
With EFS2 instead the task becomes incredibly easy thanks to its ability to handle multiple intervals. Here is one way to solve the problem.
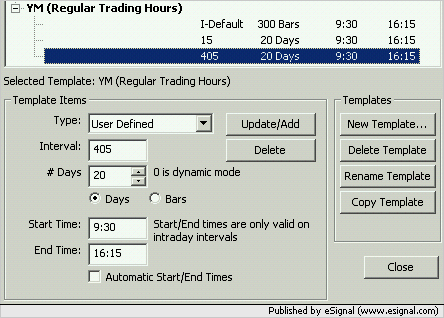
As a first step add a User Defined 405 minute Interval to the Time Template you are using and set the Start/End times to 9:30/16:15 or equivalent if in a time zone different from Eastern (see example in the following image).
Then run the following efs
You can immediately see how much more compact the code is respect to the EFS1 equivalent which by the way also needs an auxiliary efs (you can find the original scripts in the Pivots and OHLC subfolders of Formulas).
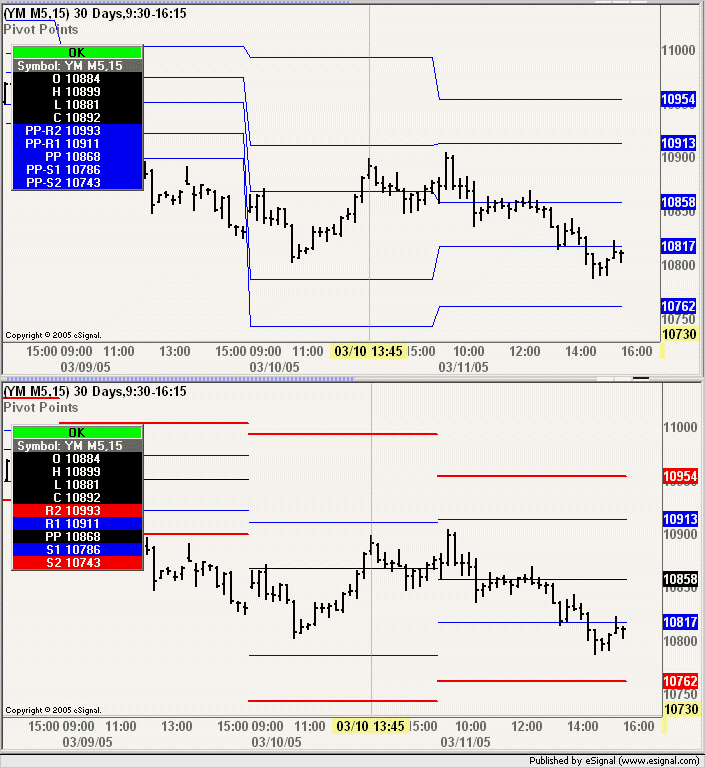
In the following image the Pivots in the top chart are based on the efs enclosed in this post while in the bottom chart they are based on the efs mentioned earlier
As you can see the Pivots are now based on RTH i.e. the High and Low of the 405 minute interval and the daily Close even though YM does not have an =2 symbol.
Notice also how thanks to the new formula engine the solution is within everyone's reach from a programming standpoint.
At this point having resolved one issue we still face the other problem created by the lack of an =2 symbol and that is the fact that Globex keeps on trading on certain holidays (which the =2 symbols skip) thereby returning incorrect values for High, Low, Pivots, etc.
Once again EFS2 makes it extremely easy for us to resolve this.
On the day that follows a holiday replace the -1 in the values of high(), low() and close() with -2. This means that instead of calculating the Pivots based on the prior day which had incomplete data we will be calculating them on the day before that which is what we would be doing if the holiday data did not exist.
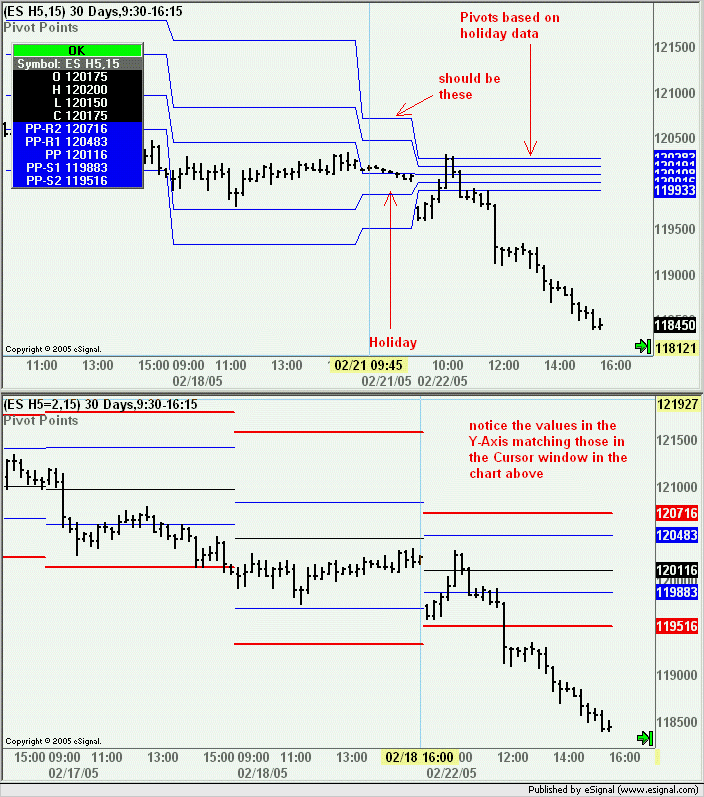
To illustrate this situation I am using the charts of ES H5 and ES H5=2 on the day following Febrruary 21nd which was a holiday. Notice that in the top chart (i.e. ES H5) the Pivots on February 22nd are different from those of the bottom chart (i.e. ES H5=2).
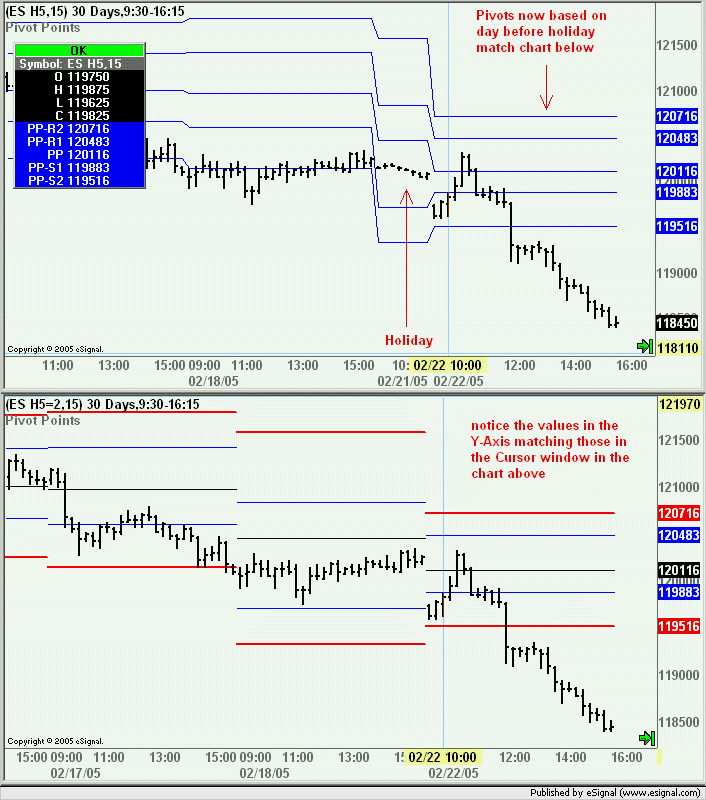
However once I modify the script to compute the Pivots based on the data from two days before they are now the same. Here is the section of the code I am modifying...
...with the following result
In the next message I will be posting a fully customizable version of the Pivot study
With EFS2 instead the task becomes incredibly easy thanks to its ability to handle multiple intervals. Here is one way to solve the problem.
As a first step add a User Defined 405 minute Interval to the Time Template you are using and set the Start/End times to 9:30/16:15 or equivalent if in a time zone different from Eastern (see example in the following image).

Then run the following efs
PHP Code:
function preMain() {


    setPriceStudy(true);

    setStudyTitle("Pivot Points");

    setCursorLabelName("PP-R2", 0);

    setCursorLabelName("PP-R1", 1);

    setCursorLabelName("PP", 2);

    setCursorLabelName("PP-S1", 3);

    setCursorLabelName("PP-S2", 4);

}


var vPP = null;

var vR1 = null;

var vS1 = null;

var vR2 = null;

var vS2 = null;


function main() {


    var vHigh  = high(-1,inv("405"));

    var vLow   = low(-1,inv("405"));

    var vClose = close(-1,inv("D"));


    if (vHigh==null||vLow==null||vClose==null) return;


    vPP = (vHigh+vLow+vClose)/3;

    vR1 = 2*vPP-vLow;

    vS1 = 2*vPP-vHigh;

    vR2 = (vPP-vS1)+vR1;

    vS2 = vPP-(vR1-vS1);


    return new Array(vR2, vR1, vPP, vS1, vS2);

}
In the following image the Pivots in the top chart are based on the efs enclosed in this post while in the bottom chart they are based on the efs mentioned earlier
As you can see the Pivots are now based on RTH i.e. the High and Low of the 405 minute interval and the daily Close even though YM does not have an =2 symbol.
Notice also how thanks to the new formula engine the solution is within everyone's reach from a programming standpoint.

At this point having resolved one issue we still face the other problem created by the lack of an =2 symbol and that is the fact that Globex keeps on trading on certain holidays (which the =2 symbols skip) thereby returning incorrect values for High, Low, Pivots, etc.
Once again EFS2 makes it extremely easy for us to resolve this.
On the day that follows a holiday replace the -1 in the values of high(), low() and close() with -2. This means that instead of calculating the Pivots based on the prior day which had incomplete data we will be calculating them on the day before that which is what we would be doing if the holiday data did not exist.
To illustrate this situation I am using the charts of ES H5 and ES H5=2 on the day following Febrruary 21nd which was a holiday. Notice that in the top chart (i.e. ES H5) the Pivots on February 22nd are different from those of the bottom chart (i.e. ES H5=2).

However once I modify the script to compute the Pivots based on the data from two days before they are now the same. Here is the section of the code I am modifying...
PHP Code:
var vHigh  = high(-2,inv("405"));

var vLow   = low(-2,inv("405"));

var vClose = close(-2,inv("D"));

In the next message I will be posting a fully customizable version of the Pivot study
Comment