 Tweet
Tweet
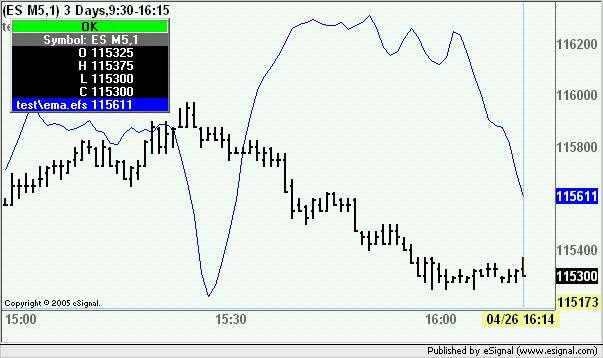
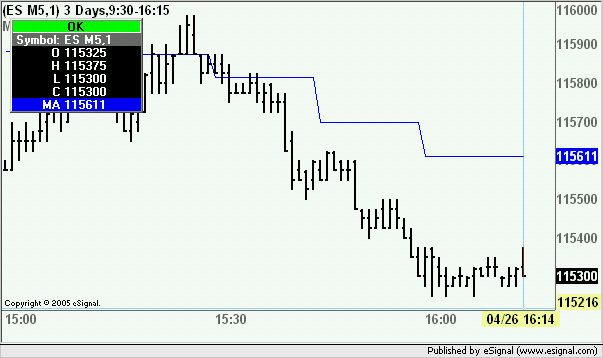
How can I display an exponential MA of one timeframe on a chart of another timeframe?
For example, displaying a 15-min 8EMA on the 1-min chart.
I tried modifying the code of Library/ema.efs where I've changed the symbol for the getValue() routine and that doesn't seem to want to print on the chart.
If I set the symbol to "ES M5,1", it prints fine. Setting to "ES M5,15" does not print.
Thinking that getValue may get confused because the 15-min candle may not have closed on the 1-min chart, I also tried with the offset set to -1, but that didn't work either.
Is there a reason this would not be possible?
Michael
---------------------
Here's the code:
/************************************************** **************************************************
Copyright © eSignal, a division of Interactive Data Corporation. 2002. All rights reserved.
This sample eSignal Formula Script (EFS) may be modified and saved under a new
filename; however, eSignal is no longer responsible for the functionality once modified.
eSignal reserves the right to modify and overwrite this EFS file with each new release.
************************************************** ************************************************** */
function preMain() {
setPriceStudy(true);
}
var dLastMA = 0.0;
var dThisMA = 0.0;
var dPercent = 0.0;
var dCount = 0;
var bPrimed = false;
function main(nInputLength) {
if(nInputLength == null)
nInputLength = 8;
var nBarState = getBarState();
var i;
var dValue;
var dSum = 0.0;
if(nBarState == BARSTATE_ALLBARS) {
// reset!
dPercent = (2.0 / (nInputLength + 1.0));
dLastMA = 0.0;
dThisMA = 0.0;
dCount = 0;
}
if(nBarState == BARSTATE_NEWBAR) {
dLastMA = dThisMA;
}
dThisMA = dLastMA;
if(bPrimed == false) {
dValue = getValue("Close", 0, -nInputLength, "ES M5,15");
if(dValue == null)
return;
for(i = 0; i < nInputLength; i++) {
dSum += dValue[i];
}
dLastMA = dSum / nInputLength;
dThisMA = dLastMA;
bPrimed = true;
} else {
dValue = getValue("Close", 0, -1, "ES M5,15");
if(dValue == null)
return;
dThisMA = (dValue - dLastMA) * dPercent + dLastMA;
}
return dThisMA;
}
Comment