Announcement

Collapse
No announcement yet.

Attaching Arrows

Collapse
X
 
  • Filter
  • Time
  • Show
Clear All
new posts

  • #16
    Steve, Alex

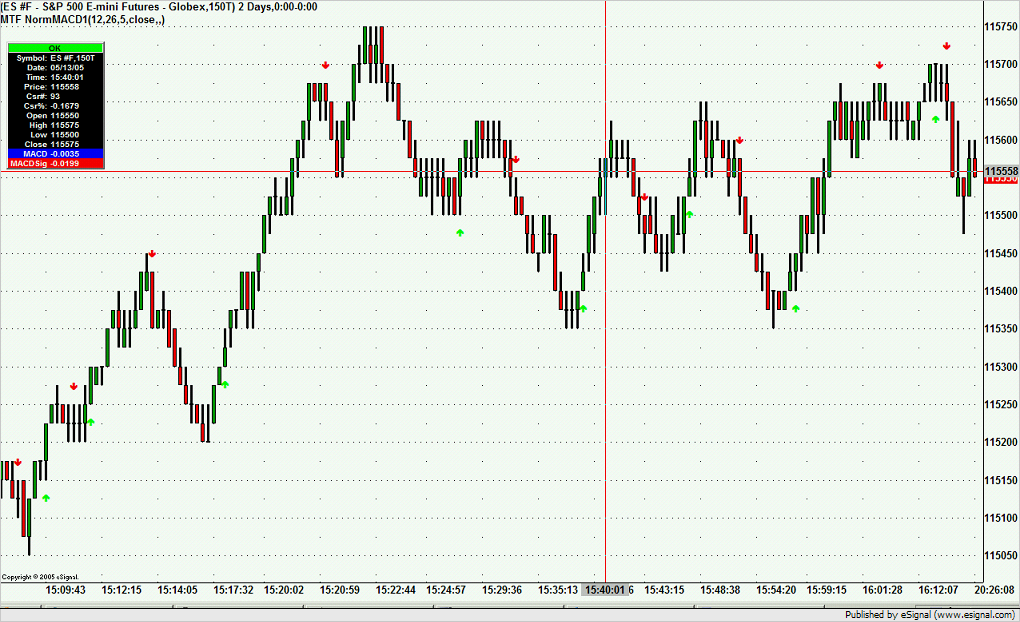
    I apologize for being a little slow on the uptake but I got it. So, I anchored the arrows to xSig as Alex suggested and I now get the arrows plotting in the study pane. Is it possible to have the arrows plot in both the price and study pane???

    With regard to Metastock, I was refering to simply adding arrows. All you do in MS is create 2 conditional statements that represent the Xover (1 long, 1 short) and select your Winding, color, and font size. It really is a quick exercise, even for non-programmer types like myself. Having said that, I still prefer the Esignal platform. I find it infinitely more flexible, more powerful and more reliable. And of course there are the great people like you and Alex and Jason and so many others who are so generous with their time and expertise. I don't think I would be here if it weren't for the members who make up the Esignal community. I hope the management understands how fortunate they are to have your participation.

    Doug
    Comment


    • #17
      Doug

      Is it possible to have the arrows plot in both the price and study pane???

      No it is not possible to plot or draw concurrently in separate panes. However you can color the price bar if you are plotting an indicator.
      Alex

      Comment


      • #18
        OK, thanks

        Comment


        • #19
          two minute arrows

          Hi Doug,

          Here is a modified method of placing arrows on the chart which borrows some methods from efs2. You should be able to plug this in directly to your efs. It will not work in a non price study as deliniated in a comment in the enclosed code snippet.

          PHP Code:
          /var space 1;//removed and replaced in drawText command with new Text.PRESET flag 
          //and AboveBar or BelowBar parameters 

          if(xMACD.getValue(0) > xSig.getValue(0) && xMACD.getValue(-1) < xSig.getValue(-1)){//modified by ACM
            
          drawTextRelative(0,BelowBar1,"é",Color.lime,null,Text.PRESET|Text.CENTER|Text.BOLD,"Wingdings",10,"Up"getCurrentBarCount());
          }else{
            
          removeText("Up"+getCurrentBarCount());


          if(
          xMACD.getValue(0) < xSig.getValue(0) && xMACD.getValue(-1) > xSig.getValue(-1)){//modified by ACM
            
          drawTextRelative(0,AboveBar1,"ê",Color.red,null,Text.PRESET|Text.CENTER|Text.BOLD,"Wingdings",10,"Dn"getCurrentBarCount());
          }else{
            
          removeText("Dn"+getCurrentBarCount()); 
          }
          //NOTE: arrows cannot be drawn in price chart if efs is non price study 

          To make the efs plot in the price study place the following line in the premain section, and modify the return statement as denoted below. (you will have to remove then reload the efs from the chart as well)

          PHP Code:
          setPriceStudy(true);//uncomment this line if drawing arrows in price pane

          -AND- 

          return new Array (
          getSeries(xMACD),getSeries(xSig));
          //return ;//uncomment this line and comment out line above if efs is setPriceStudy(true) 
          Now, in efs2, the eSignal staff (and others) recognized there should be an easier method to place arrows or other shapes on the chart. For fun, I will call these two minute arrows.
          PHP Code:
          //draw a DOWNARROW above the high of the current bar 
          drawShapeShape.DOWNARROWAboveBar1Color.red, ); 

          //draw an up arrow below the low of the current bar and color it red 
          drawShapeShape.UPARROWBelowBar1Color.green ); 
          I haven't used these much, except early in the beta release, they are quite nice. With the other shapes available, plus a new drawText() feature that behaves similarly, they are quite powerful (and two minutes fast;>)).

          Comment


          • #20
            Hi Steve

            Had me lol with the "2 minute" comment.

            I will give it a shot, thanks much.

            Regards
            Doug

            Comment


            • #21
              Arrows that don't show/print

              Hi

              Does anyone know of a reason why arrows based on a crossover, such as with an MACD or MA, might not show/print at some of the crossovers?? I have a situation where they(arrows) appear at ~95% of the crossovers but fail the other 5% of the time. It appears to be affaected by the interval as a smaller time frame produces many more crossovers and therefor a higher % of failures vs. higher timeframes which appear to catch virtually all the crossovers.

              Any insights would be greatly appreciated.

              Thanks
              Doug

              Comment


              • #22
                Doug,

                Is this with the same fixed timeframe and symbol specified in the efs, then you are running the efs in different time frame charts? Or rather, you are just running it without specifying timeframe or symbol in different timeframe charts?

                Perhaps you could post some charts as well.

                Comment


                • #23
                  Hi Steve

                  It is an EFS attached to a chart of a different interval. It occurs both when the EFS is of a shorter interval than the chart and also when the EFS is of a longer interval than the chart. However, the frequency appears to be much greater when the EFS is of a shorter interval than the chart.

                  I suspect it has something to do with synchronization but why it would work sometimes and not others is a little confusing.

                  Doug

                  Comment


                  • #24
                    Steve

                    Upon closer inspection I am finding that it only occurs when the EFS interval is smaller than the chart interval, not greater than the chart interval as I had previously stated.

                    Sorry for the mistake.

                    Doug

                    Comment


                    • #25
                      Hi Doug,

                      I believe you have identified exactly why it is behaving as it is. See if this makes sense.

                      When you place the arrows on your chart with the drawTextRelative commands, you are providing a unique label which uses the barcount of the advanced chart you are running. If during the current bar (of the chart that you are in), a crossover occurs in the interval you have chosen specifically for the efs, then, uncrosses, all within the same chart bar, the arrow will be removed since the unique identifyer is based on the chart bar.

                      Try removing these steps with the removeText commands (for both the up and down arrows ) by commenting them out:
                      PHP Code:
                      removeText("Up"+getCurrentBarCount()); 
                      Now, see if the arrows stay where you expect them to (and perhaps you will now have many more arrows as well as now, all crossovers regardless of the interval will remain on the chart.

                      Very interesting behavior btw.

                      Comment


                      • #26
                        Steve

                        Once again, thank you for the education. You are right, it is interesting behavior and I think I may actually be able to put it to some use as an escoteric filter of sorts. Although that will require further experimentation now that I understand what is actually happening.

                        Thanks again, you da man :-)

                        Doug

                        Comment


                        • #27
                          Hey again Steve

                          On slightly different but related subject, do you know if it is possible to use the interval synchronization function to creat a single advanced chart that displays 2 price panels i.e. a 5min over 30min?? I haven't come across anything similiar but it seems like it might be possible with EFS2's enhanced functionality.

                          What do you think??

                          Doug

                          Comment


                          • #28
                            Hi Doug,

                            No, it isn't possible. You would have to have two seperate advanced charts. I would suggest that you try and open up two charts, one a 5 minute and the other a 30 minute. While not a new feature, you can always save this configuration as a page, then, with the page toolbar displayed, you can either toggle through your pages, this being one of them, or just open the page if you would like.

                            Comment


                            • #29
                              Hi Steve

                              Thanks for the reply. I have them both up as part of a layout across 2 screens but it would be nice to have 1 over the other in synchronization. Oh well, maybe in the future.

                              Regards
                              Doug

                              PS - the other day someone commented on your avatar and they are right, once you start looking at it, it's hard to stop

                              Comment


                              • #30
                                Hi Doug,

                                You are welcome. Regarding synchronization, I thought there would be synchronization, but have not tested it. I hope you can come up with a solution that works out.

                                After we have worked through the project, I thought it would be helpful if we published at least one version of what we came up with. This one plots the arrows to the price pane and sends the values to the cursor window (not to the price pane).

                                Thanks for your patience and humor, this exercise was not only enjoyable, but also mutually educational.

                                PHP Code:
                                var fpArray = new Array();
                                var 
                                amLib addLibrary("amStudies.efsLib");

                                function 
                                preMain() {

                                setPriceStudy(true);//uncomment this line if drawing arrows in price pane
                                //see also return statement 
                                    
                                setStudyTitle("MTF NormMACD1");
                                    
                                setCursorLabelName("MACD",0);
                                    
                                setCursorLabelName("MACDSig",1);
                                    
                                setDefaultBarFgColor(Color.blue,0); 
                                    
                                setDefaultBarFgColor(Color.red,1);
                                    
                                setPlotType(PLOTTYPE_LINE,0);
                                    
                                setPlotType(PLOTTYPE_LINE,1); 
                                    
                                setDefaultBarThickness(1,0);
                                    
                                setDefaultBarThickness(1,1);
                                    
                                setDefaultBarThickness(1,2);
                                    
                                askForInput();

                                    var 
                                x=0;
                                    
                                fpArray[x] = new FunctionParameter("Fast"FunctionParameter.NUMBER);
                                    
                                with(fpArray[x++]){
                                    
                                setLowerLimit(1); 
                                    
                                setDefault(12);
                                    }
                                    
                                fpArray[x] = new FunctionParameter("Slow"FunctionParameter.NUMBER);
                                    
                                with(fpArray[x++]){
                                    
                                setLowerLimit(1); 
                                    
                                setDefault(26);
                                    }
                                    
                                fpArray[x] = new FunctionParameter("Smoothing"FunctionParameter.NUMBER);
                                    
                                with(fpArray[x++]){
                                    
                                setLowerLimit(1); 
                                    
                                setDefault(5);
                                    }
                                    
                                fpArray[x] = new FunctionParameter("Source"FunctionParameter.STRING);
                                    
                                with(fpArray[x++]){
                                    
                                addOption("open"); 
                                    
                                addOption("high"); 
                                    
                                addOption("low"); 
                                    
                                addOption("close"); 
                                    
                                setDefault("close"); 
                                    }
                                    
                                fpArray[x] = new FunctionParameter("Symbol"FunctionParameter.STRING);
                                    
                                with(fpArray[x++]){
                                    
                                setDefault("");
                                    }
                                    
                                fpArray[x] = new FunctionParameter("Interval"FunctionParameter.NUMBER);
                                    
                                with(fpArray[x++]){
                                    
                                setDefault("");
                                    }
                                }

                                var 
                                bInit false;
                                var 
                                vSymbol null;
                                var 
                                xMACD null;
                                var 
                                xSig null;

                                function 
                                main(Fast,Slow,Smoothing,Source,Symbol,Interval){

                                if(
                                bInit == false){
                                        
                                addBand(0,PS_SOLID,1,Color.aqua,"Centerline");
                                        if(
                                Symbol == nullSymbol getSymbol();
                                        if(
                                Interval == nullInterval getInterval();
                                        
                                vSymbol Symbol+","+Interval;
                                        
                                xMACD amLib.amDEMA(2,efsInternal("ratio",Fast,Slow,eval(Source)(sym(vSymbol))));
                                        
                                xSig wma(Smoothing,getSeries(xMACD));
                                        
                                bInit true;
                                }
                                    
                                    if(
                                xMACD.getValue(0) > xSig.getValue(0) && xMACD.getValue(-1) < xSig.getValue(-1)){//modified by ACM
                                        
                                drawTextRelative(0,BelowBar1,"é",Color.lime,null,Text.PRESET|Text.CENTER|Text.BOLD,"Wingdings",10,"Up"getCurrentBarCount());
                                    }else{
                                        
                                removeText("Up"+getCurrentBarCount());
                                    } 
                                    
                                    if(
                                xMACD.getValue(0) < xSig.getValue(0) && xMACD.getValue(-1) > xSig.getValue(-1)){//modified by ACM
                                        
                                drawTextRelative(0,AboveBar1,"ê",Color.red,null,Text.PRESET|Text.CENTER|Text.BOLD,"Wingdings",10,"Dn"getCurrentBarCount());
                                    }else{
                                        
                                removeText("Dn"+getCurrentBarCount()); 
                                    }
                                    
                                //NOTE: arrows cannot be drawn in price chart if efs is non price study
                                    //return new Array (getSeries(xMACD),getSeries(xSig));
                                        
                                return new Array (getSeries(xMACD).toFixed(4),getSeries(xSig).toFixed(4));//uncomment this line and comment out line above if efs is setPriceStudy(true), 
                                        //note, in return line above, toFixed converts to text value which only returns values to cursor window, not to chart


                                //you need to pass the parameters to the function
                                function ratio(fast,slow,source){
                                    var 
                                sht wma(fast,source);
                                    var 
                                lng wma(slow,source);

                                    var 
                                ratio = (Math.min(sht,lng)/Math.max(sht,lng));

                                    var 
                                ret sht>lng?((2-ratio)-1)*100 : ((ratio)-1)*100;

                                    return 
                                ret

                                Comment

                                Working...
                                X