Announcement

Collapse
No announcement yet.

Including other timeframes on the chart

Collapse
X
 
  • Filter
  • Time
  • Show
Clear All
new posts

  • Including other timeframes on the chart

    Hi,

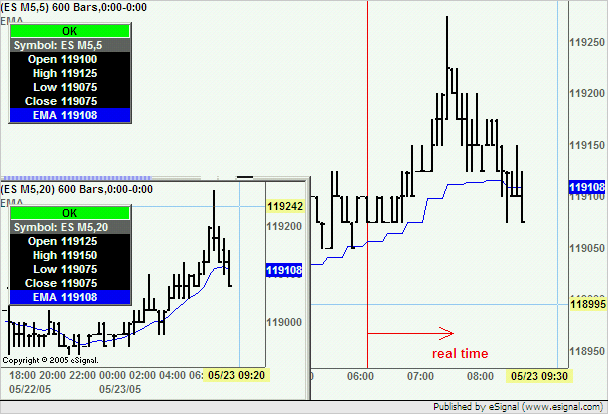
    I use an ema 21 bar fomr the 20min time frame on my 5min chart and it goes screwey...

    Ie "return (ema(21,inv(20)))"

    However, the bars change in the realtime environment and even adding "BARSTATE_NEWBAR" has not solved the problem.

    The only way I can get a reliable display is to reload the script continuously.....

    Any ideas?

    Rene'.

  • #2
    Rene
    What exactly do you mean with "going screwey"? You may want to post your efs so that others can try to replicate the problem.
    You may also want to try the customMA.efs that is in the EFS2 Custom folder and that is preset to be used with multiple intervals
    Alex

    Comment


    • #3
      Hi,

      No, I have not tried the customMA but, I thought that the function I used should work as per the help file.

      Also, by screwy I mean that the updates to the bars in realtime (as it is forming) causes the script to display incorrect results that changes with every tick.

      The probem is less severe when I check the bar state, but the results are still incorrect and need constant reloading to see the correct results.

      The script is pretty simple.................

      //=================================

      function main() {

      var nState = getBarState();

      if (nState == BARSTATE_NEWBAR) {
      return (ema(21,inv(20)));
      }

      }

      //=================================


      My understanding from the help file is that this should work....and it does work after a reload and as long as no new ticks arrive.

      Regards,
      Rene'.

      Comment


      • #4
        Rene
        I tried the following efs which should replicate what you were doing and the real time plot appears to match that of the external interval. The screenshot below was taken without refreshing the chart after the enclosed efs had run in real for approximately 40 minutes
        Not sure as to why you may be showing instead incorrect data
        Alex


        PHP Code:
        function preMain() {
            
        setPriceStudy(true);
            
        setStudyTitle("EMA");
            
        setCursorLabelName("EMA",0);
            
        setDefaultBarFgColor(Color.blue,0);
        }

        function 
        main() {

            return 
        ema(10,inv(20));

        Comment


        • #5
          Maybe a suggestion for the future would be to have interval as an option on the basic studies selection menu.

          Paul.

          Comment


          • #6
            Hi,

            Thanks for your reply.
            When I try the script it goes wrong almost immediately.

            See chart of $INDU attached. The red vertical line is when the script was last reloaded.

            As you can see, the indicator jumps straight up after a couple of ticks have been received.

            Very strange....

            PS: I am using a 5 min timeframe for my base chart.

            Rene'.
            Attached Files

            Comment


            • #7
              Hello Rene,

              I've been testing this the past 10 minutes or so and I'm not seeing the same problem you're having. So far at least. What is the build number of the version you're using under Help-->About? Also, please post the EFS you are using as an attachment. I need to see if we have any other differences between code.
              Jason K.
              Project Manager
              eSignal - an Interactive Data company

              EFS KnowledgeBase
              JavaScript for EFS Video Series
              EFS Beginner Tutorial Series
              EFS Glossary
              Custom EFS Development Policy

              New User Orientation

              Comment


              • #8
                Hi,

                Using 7.9 build 710, 04/04/05.

                The script is a copy of the one posted by Alexis....

                function preMain() {
                setPriceStudy(true);
                setStudyTitle("EMA");
                setCursorLabelName("EMA",0);
                setDefaultBarFgColor(Color.blue,0);
                }

                function main() {

                return ema(10,inv(20));
                }

                As soon a tick arrives, the indicator jumps up.
                It also does the same thing in replay mode.

                Rene'.

                Comment


                • #9
                  Hello Rene,

                  You are using an older beta version of 7.9. Please visit the following link and upgrade to build 719. This will correct your problem.

                  Download eSignal 7.9
                  Jason K.
                  Project Manager
                  eSignal - an Interactive Data company

                  EFS KnowledgeBase
                  JavaScript for EFS Video Series
                  EFS Beginner Tutorial Series
                  EFS Glossary
                  Custom EFS Development Policy

                  New User Orientation

                  Comment

                  Working...
                  X