Announcement

Collapse
No announcement yet.

EFS2 Custom Data Series - Perfomance Issues

Collapse
This topic is closed.
X
X
 
  • Filter
  • Time
  • Show
Clear All
new posts

  • #16
    EFS2 Custom Data Series - Perfomance Issues

    This is a continuation of my previous post, but because I made it work [Thank you Alex and Jason], I reduced the problem to execution performance of the converted script.

    I did play around [trying the best solution] and here is what I get:

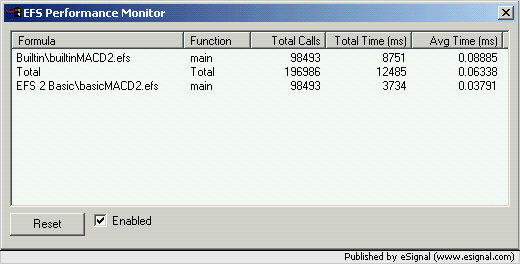
    a/ Builtin EFS2 studies introduce an additional overhead which translate in 12-20% performance degradation. This seems to be known.

    b/ Custom data series declared with esfInternal [once loaded] introduce 20-25% performance deterioration [2.1ms vs 1.7, for example].

    c/ [And here is the real problem] Custom series declared with efsInternal introduce 200% - 500% performance deterioration during the initial loading [when symbol or base time frame is changed, which I do a lot during the day]. For the example above, the execution time becomes 8.5-9 ms pe bar, during initial loading.
    This happens regardless when the first execution of the efsInternal occurs.

    Here is a typical example of such custom data series:
    studyMAxRSI = efsInternal( "CalcNormalizedRSIFunction", Param1, Param2, rsi(RsiPer, StudyMAx));
    where studyMAx = sma(MAPer, SourceMx);
    where SourceMx = hlc(inv(Mx));

    I also tried to replace the StudyMAx with its instance [studyMAx.getValue()], but same result.

    Note: I noticed that there are 6+ calls per bar of each "CalcNormalizedRSIFunction" during initial loading [NoOfefsInternal x NomberOfBars x 6+]. Is this normal?
    The total overhead, as reported by Performance Monitor, of those calls amounts to about 40% of the total time [individual time is very low, but there are very many], which tells me that there are other sources of overhead during initial loading.

    If anybody can clarify if this is normal, or I am doing something wrong, I would be grateful. I need to make a decision if continue with conversion or get back to EFS1.

    Thank you,
    Mihai
    Last edited by mbuta; 05-28-2005, 06:27 PM.
    Mihai Buta

    Comment


    • #17
      Performance

      Mihai;

      I am at the beginning of testing EFS7.9 versus the prior version. I posted on 5/18 questions about the conversion prior to starting. Only by dumb luck I loaded 7.9 on an old computer (1.0GZ) and started to convert while keeping the old version on my new machine. Because the old computer is 1.0 vs my current 3.0 I assumed the slightly slower performance was due to the computer. What operational / practical performance characteristics are you seeing degrade? Since I am at the very beginning of the conversion you guidance as to the problem areas would be helpful so I can test these out for confirmation. As a reference, I run 10 charts fron low ticks up to 60M with 40 EFS studies (total about 8,000 lines of code) running simultaneously.

      Best Regards,

      Alan

      Comment


      • #18
        Hi Alan,

        I explained the performance impact in my post.
        EFS2 introduces between 15-25% performance degradation on same studies. If you declare custom data series with efsInternal, there is a big impact when chart loads, in top of that.

        I was hopping that with EFS2 the performance will improve, by executing high interval studies only on those time interval boundaries, but apparently is not so. They execute as often as the base interval studies.
        I was also hopping that ref(-1) of a higher interval study would refer to that time interval's bar, but this is also not true. It refers to bar chart.

        As I process the base studies heavilly before using them, so far, I don't much advantage from EFS2, other than it fills the chart to the first bar on any interval. This allows me to run less bars [say, 450 instead of currently 600 bars], but this does not compensate for the performance impact. It is still faster to load 600 bars in EFS2 than 300 in EFS when using custom data series.

        I hope I am totally wrong and someone will point me how all these can be avoided, because I am about to give up on EFS2 all together. It brings us back in time to the pre-merger with AdvancedGET era and becomes as slow as TradeStation, which is for free and has a lot of built in features [for charting and trading].
        The nicest feature of EFS1/GET [the ability to navigate quickly to other symbols, pages] virtually dissapears in EFS2.

        Note: You need to run old and new versions on the same machine to see the real impact.

        Good Luck!
        Last edited by mbuta; 05-29-2005, 10:10 AM.
        Mihai Buta

        Comment


        • #19
          Performance

          Mihai,

          In my prior questions to Alex (5/18), I was advised not to load the new and old versions onto one computer. That is what drove me to using two computers. I felt it was better to convert independently of the existing 7.8 trading system for fear of conversion problems interrupting active trading. Prior experience with many systems has taught me to be cautious and test new systems carefully even after beta testing is complete. ( Your current experiences are reconfirming this. )

          How were you able to load two versions on one computer and could this be one possible source of the problem if there is some sort of conflict between files or shared resources between the two versions?

          Best Regards,

          Alan

          Comment


          • #20
            Hi mbuta:

            It all depends on how you write the EFS.

            In EFS1 when you do:

            var v = new MAStudy(...).

            and then reuse that v with v.getValue(), you are doing two things:

            1. creating a new internal MAStudy object in native (C++ code).
            2. creating a JavaScript object assigned to v.

            In EFS2 whenever you do:

            ema(...)

            you are also doing the above two things (although #1 only happens ONCE per EFS lifetime, given the same parameters, the engine caches it for you).

            Now, if you wish to only have #2 happen once, then simply call the ema(...) outside of the function scope, and reference the resulting Series object 'v', within your function scope... ie:

            PHP Code:
            var myEma ema(...)
            function 
            main() {
               
            // use myEma.getValue() in various places.

            The result of this is that you will have done #1 and #2 just ONCE per chart.

            There should not be a 15-25% performance degredation on builtin studies. If that is happening, it might be that you are using ema(...) within the main() function scope multiple times. In which case you would still only incur one C++ object creation (#1), but multiple JavaScript object creations (#2).

            efsInternal() does introduce a delay whenever used. The first time it encounters an efsInternal, it checks to see if it has been executed before (that is, with the same parameters as before). If not, it will STOP your main script execution, set up the efsInternal() as a separate EFS, execute that, then return to your main script execution.

            Now, in your example:

            PHP Code:
            studyMAxRSI efsInternal"CalcNormalizedRSIFunction"Param1Param2rsi(RsiPerStudyMAx));
            where studyMAx sma(MAPerSourceMx);
            where SourceMx hlc(inv(Mx)); 
            Does MAPer or Mx change at all during the excution of your EFS? If they do, that creates a new sma study, which creates a new RSI study, which in turn creates a new efsInternal, which restarts the calculation for your entire EFS chain. This will account for the slowness you've observed in this instance. But it's extremely hard to say w/o the full EFS source code to observe.

            BTW: If you can get by w/o needing the timeframe synchronization aspects of EFS2, by all means keep using the EFS1 unsynchronized functions, those will remain in the engine forever. The synchronization does add some overhead, however I believe most of the additional processing problems that you're seeing could be correct with a rearrangement of the code.

            Comment


            • #21
              Alan,

              I have only one version of eSignal [7.9], and run EFS1 and EFS2 versions on my script on the same chart.
              Mihai Buta

              Comment


              • #22
                Hi Dion,

                Thank you for your competent respose.

                1. This exactly what I was looking for, to declare my studies outside main(), but I tried to declare hlc3() as source and it gave error [hlc3() can only be used in main], so I assumed that all EFS2 stuff must be declared inside main.
                I did try to use "HLC3" as source for an EFS2 study and it was accepted. I will try to re-convert the rest of them and I will report the results.

                2. I know that ANY change in parameters will create a new series, so I am refering only to same set of parameters.
                However, when loading a script, the efsInternal is called many times, as i provided in original post. After that, it is only once per bar [when I force efs to reload, with the same symbol and base interval].

                3. One other question for you. Why do we need to declare each component of a study [see MACD, Stoch, the so called Bollinger Bands, ADX, etc.]. This, obviously creates additional overhead.
                Mihai Buta

                Comment


                • #23
                  BTW mbuta,

                  I've gone back and read a few more of your posts over the last few weeks. It seems like you were doing some rsi( length * intervalFactor) calculations in order to simulate RSI calculations on higher intervals, is this correct?

                  If so, that's the reason why you're seeing the performance discrepency. With EFS2, you're actually doing the calculations on the higher interval, whereas a length * intervalFactor in a built-in in EFS1 is just an estimate of the values that you will get. The values will be approximately equal, but not exactly. I understand now why you have been eliminating # of bars loading with EFS2, since you were using the EFS1 kludge of an intervalFactor in the builtin studies.

                  Nothing wrong with that, but you should be aware that you may not get the same values as the calculations are not equivalent in all cases (and also depends on the study used). And since you are doing fewer calculations than in your EFS2 formulas, your original will be faster.

                  Comment


                  • #24
                    #1. ahh, in that case, declare the variable outside of main(), assign it to 'null'. Then inside main, if it's null, declare the EFS2 series with hlc3(). I'm not sure why "HLC3" works for you, I don't believe that it should. But if you follow the above, you will get the same behavior and save a few JavaScript objects from creation.

                    #2. It depends, do you nest efsInternal calls? ie does CalcNormalizedRSI call efsInternal itself? or a different timeframe ? The EFS engine does build up a dependency list. So if it encounters a new timeframe or efsInternal during execution, it has to stop, execute that, then restart the initial execution. If there are a number of them in a chain, then the initial execution will be called a number of times, in order to be sure that the engine has calculated all of the numbers that you need.

                    #3. This was done for simplicity's sake. In the backend, this will be optimized to use just a single MACD or Bollinger calculation instead of the multiple ones right now. It was done in order to allow users to chain EFS2 studies one on top of each other. One of the goals of EFS2 was to have a macro-like language, so that the basic users (who make up the majority of our target for EFS2) will be able to write out one-line scripts or formulas without having to deal or know about variables, Classes, objects, etc... for more experienced programmers like you though, these things do tend to get in the way, and knowing how the EFS2 objects are constructed internally (ie, attempting to optimize as in #1) are things we hope to educate upon.

                    Comment


                    • #25
                      Dion,

                      Thank you again for your reply and the time you put to clarify these issues.

                      #1. How you suggest it is exactly how I have it: vars outside and declare the studies inside main. The only diference is that I do it on ALLBARS for all of them [saves repeated if (Xstudy==null) inside main.
                      I have to do it like that, because I use dynamic higher intervals, based on the base chart [2/5/15, 5/15/30, 30/60/D, D/2D/W] and cannot know the base interval begore main.
                      You are also correct about "almost" the same results and this why I wanted to use EFS2. Same is true about the number of bars needed to get the same amount useful chart [I hate to have to run 600 bars to get 300 I can use].

                      About "HLC3": I can tell you that [by accident] I saw that you can use EFS1 way to retrieve the the CCI value, from a EFS cci study. Apparently, this holds true for all studies that return only one value.
                      I only hope that you would allow us to retrive multiple return values from the same EFS2 series, like MACD, ADX, Stoch, etc.
                      I also hope that you will revise the multiple interval engine, to execute only once per that interval bar [this would save execution time].
                      I also hope that ref(-1) in a diferent time interval would refer to that time interval, rather than chart bars.

                      2. Yes, there is some "nesting", as reported in original post: I do EFS(MAx(inv(Mx)), but MAx(inv(Mx)) and inv(Mx) are already declared before and refer to them by their names. I do not re-declare them.

                      3. Dion, I am no programmer, by no strech of imagination, but I have been around for a while. Please treat me as a "target" for EFS2, I am no better [Besides, I am lazy and not too smart, so I need things to be easy and simple].

                      Thanks again,
                      Mihai
                      Mihai Buta

                      Comment


                      • #26
                        Perhaps I am missing something with regards to the statements about EFS2 builtin studies being less efficient than the EFS1 equivalents.
                        FWIW here are my results for the following two scripts (the first one is in EFS1 syntax while the other is in EFS2 syntax).

                        PHP Code:
                        function preMain() {
                            
                        setPriceStudy(false);
                            
                        setStudyTitle("MACD");
                            
                        setCursorLabelName("MACD",0);
                            
                        setCursorLabelName("MACDSig",1);
                            
                        setCursorLabelName("MACDHist",2);
                            
                        setDefaultBarFgColor(Color.blue,0); 
                            
                        setDefaultBarFgColor(Color.red,1);
                            
                        setDefaultBarFgColor(Color.magenta,2); 
                            
                        setPlotType(PLOTTYPE_LINE,0);
                            
                        setPlotType(PLOTTYPE_LINE,1);
                            
                        setPlotType(PLOTTYPE_HISTOGRAM,2); 
                        }

                        var 
                        vMACD null;

                        function 
                        main() {

                            if (
                        vMACD == nullvMACD = new MACDStudy(12269"Close"falsefalse);

                            return new Array (
                        vMACD.getValue(MACDStudy.MACD),vMACD.getValue(MACDStudy.SIGNAL),vMACD.getValue(MACDStudy.HIST));

                        PHP Code:
                        function preMain() {
                            
                        setPriceStudy(false);
                            
                        setStudyTitle("MACD");
                            
                        setCursorLabelName("MACD",0);
                            
                        setCursorLabelName("MACDSig",1);
                            
                        setCursorLabelName("MACDHist",2);
                            
                        setDefaultBarFgColor(Color.blue,0); 
                            
                        setDefaultBarFgColor(Color.red,1);
                            
                        setDefaultBarFgColor(Color.magenta,2); 
                            
                        setPlotType(PLOTTYPE_LINE,0);
                            
                        setPlotType(PLOTTYPE_LINE,1);
                            
                        setPlotType(PLOTTYPE_HISTOGRAM,2); 
                        }

                        var 
                        vMACD null;
                        var 
                        vSig  null;
                        var 
                        vHist null;

                        function 
                        main(){

                            if(
                        vMACD==nullvMACD macd(12,26,9);
                            if(
                        vSig==null)  vSig  macdSignal(12,26,9);
                            if(
                        vHist==nullvHist macdHist(12,26,9);

                            return new Array (
                        vMACD.getValue(0),vSig.getValue(0),vHist.getValue(0));

                        The studies were run side by side on the same chart in tick replay over 10 days of data and the results from the Performance Monitor are the following.


                        As has happened every time I have done these measurements over the course of the last year or so the EFS2 version appears to be considerably more efficient.
                        Alex

                        Comment


                        • #27
                          Thanks Alex, for the timings. I should repeat for everyone's benefit, EFS2 is NOT slower than EFS1 in terms of performance speed (indeed, the exact same backend code is used for the builtin studies, and as Alex has shown, sometimes it's even faster). The only time that there is a difference is if the coding logic is in itself different (ie, using the EFS1 hack of an intervalFactor rather than the exact EFS2 multiple time frame calculation).

                          #1. ALLBARS sounds like a good place for this.

                          What exactly do you need to use ref(-1) on? Are you retrieving a past data value from your EFS? if so, it will work in the current timeframe, which is expected. I'm not sure what you are trying to retrieve here. If you need to retrieve a bar from a higher interval, simply do close(inv("10"), -1) where "10" is your interval, -1 is your bar index. Same goes with high, open, low, close, hlc3(), etc...

                          You can retrieve multiple data Series from the same calculation in v7.9.1, for efsExternal() and efsInternal() calls. This is not available for the builtin studies yet.

                          Comment


                          • #28
                            Hi all,
                            As I said before, I hope that I am dead wrong in this performance issue of EFS2. However, there is a big diference between some pure vanilla one study script, ran for 10 days and my reality world, where I have many indicators, processed and inter-related and where the symbols and base intervals are flipped many times during the trading day, in the search for a trading opportunity.

                            In this type of environment, the results are diferent [so far] and I present below some of them.
                            All you see here is one script, plotting diferent sets of indicators, in lower pane or as PriceStudy. Version 7.1g is still EFS1, version 7.1h has most studies [except ADX, RSI, MoneyFlow] converted to EFS2.
                            EFS2 is consistently less performant by 15-25% after any number of releads.

                            First three examples are simple studies [Stoch, MACd, MA-RSI , in three time-frames], where only part of the code is executed, the last two example require almost entire code to be executed [no Pivots and no Trade Signals, which are finished yet].
                            In first example you can also see the result when the code in ran as PriceStudy [also requires most of the code and you can see that they are super-imposed - the staired ones are in EFS2].

                            One last note: These are examples using only builtin studies as data series, because if I declare my normalized indicators as data series with esfInternal, the loding time increasses by factor of 5-8 compared with EFS1.

                            Stochastic in lower pane and MA10/MA20/MA50.MA100 and Bollinger Bands in BaseInterval and M2.


                            MACD and Signal in all three time intervals


                            RSI of all MA from Upper pane


                            Reg M2: BaseM2 [MA100RSI+MACdM2+OscM2] and StochD-M2 and CCI-M2 shown


                            Some OB/OS indicator for all three time intervals


                            Now, why I would want to ref higher intervals? I am calculating forward looking pivots, for all time intervals, which I store in arrays, as they occur, by their Bar Index. Later, I want to be able to retrieve diferent indicators' value at the pivot time [to determine divergencies and price targets based on Fibbonacci, for example].
                            Dion, did I understand correctly? In a 2min chart close(inv(15),-1) will give me the close of the previous 15min bar, not the 2min bar?

                            Thank you all.
                            Last edited by mbuta; 05-30-2005, 06:15 AM.
                            Mihai Buta

                            Comment


                            • #29
                              Mihai

                              In a 2min chart close(inv(15),-1) will give me the close of the previous 15min bar, not the 2min bar?

                              Actually the syntax is close(-1,inv(15)) and it will return the value of the external interval's prior bar (see image below). The barIndex is the last [optional] parameter when used with builtin studies
                              Also if you declare a study such as for example var x = sma(10,inv(15)) then you use x.getValue(-1) this will return the value of the indicator at the prior bar on the external interval
                              Alex

                              PHP Code:
                              function preMain(){
                                  
                              setPriceStudy(true);
                                  
                              setStudyTitle("test")
                              }

                              function 
                              main(){

                                  return 
                              close(-1,inv(15));

                              Comment


                              • #30
                                Thank you very much, Mihai.

                                ziggy

                                Comment

                                Working...
                                X