Announcement

Collapse
No announcement yet.

EFS2 Multi time Frame Sychronization

Collapse
X
 
  • Filter
  • Time
  • Show
Clear All
new posts

  • EFS2 Multi time Frame Sychronization

    As instructed in a previous post, study.getValue() is not the correct way to plot an EFS2 data series in real time and getSeries should be used instead.

    This suggests that using study.getValue for other usages [inside the script] is also incorrect.

    If this is the case, what is the the correct way to retrieve the correct value of a data series in other time interval?

    Thank you.
    Mihai Buta

  • #2
    Mihai
    I don't believe that either Dion or I said that using getValue() was the incorrect way. What we said was that if you want the plots to be syncronized without having to do that yourself (in your case using reloadEFS) then you should return the series rather than value. Dion also explained as to why this would be required.
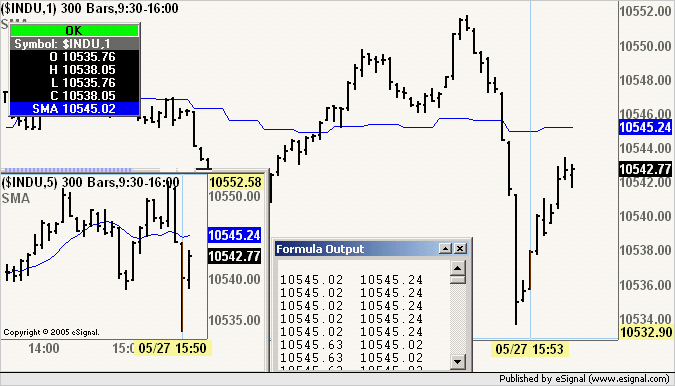
    getValue() will return the correct value at any time for the external interval. For example if you have the following var x = sma(10,inv(5)) and you are plotting this on a 1 minute chart then x.getValue(0) and x.getValue(-1) will return the values of the study at the current and prior bar of the external interval (ie the 5 minute). See the enclosed sample code and resulting image.
    Alex

    PHP Code:
    function preMain() {
        
    setPriceStudy(true);
        
    setStudyTitle("SMA");
        
    setCursorLabelName("SMA",0);
    }
     
    function 
    main() {
     
        var 
    sma(10,inv(5));
        
        
    debugPrintln(formatPriceNumber(x.getValue(-1))+"  "+formatPriceNumber(x.getValue(0)))
     
        return 
    x;

    Comment


    • #3
      Following up on my prior reply. There is one thing that cannot be done at this time from within main() and that is detect when a new bar has formed (ie BARSTATE_NEWBAR) on an external interval.
      This should be available with version 7.9.1. For now a new bar can be detected if getBarState() is running in an external function (or efs) and the last parameter passed to that function is a series containing symbol or interval.
      Alex

      Comment


      • #4
        You are right Alex, neither you nor Dion said it is incorrect, but based on your follow up reply, in amounts to the same thing [until next release].

        The question is, is there a way to get the correct values, for inside use [not for plotting]?

        Thank you.
        Mihai
        Mihai Buta

        Comment


        • #5
          Mihai
          No it does not amount to the same thing. It depends on what you want to do. If you want the plot syncronized then you return the series else you can return the value.
          As to your second question see the example I provided in my earlier reply.
          Alex

          Comment


          • #6
            Mihai,

            Both getValue and getSeries will return the EXACT same thing within the script.

            As Alex mentioned, it is only if you want the plot adjusted for a higher timeframe do you return a Series object from main().

            If you're on a 1 minute chart, and using data from a 5 minute chart, if you simply return a number from main(), there is no way for the engine to trace the origin or intention of that number. By returning a Series object (which is returned directly or through getSeries), the engine can infer your intention, detect the underlying interval of that Series object, and plot it the way you desire.

            Both are completely correct, and as Alex has already mentioned, it depends on what YOU intend to do with the data.

            Comment


            • #7
              Well, I am no expert, but I have hard time accepting that the same value is not good enough to plot, but it is good enough to make trading decision based upon.

              Again, it is ok if things are not perfect yet and I only asked how to get around it and trust that I have the correct value, when I decide to commit real money.
              Mihai Buta

              Comment


              • #8
                Mihai, that is entirely up to you. We have traders wanting it both ways so we provide it both ways. It's up to you to design a system that fits your needs.

                Nothing is changing in future versions in this regard.

                Comment


                • #9
                  Mates,

                  I recently discovered the dangers in using getValue for returned data in real time on a multi-timeframe setup.. I have one question however:

                  i am using:

                  PHP Code:
                  var  interval 240;
                  var  
                  symbol "JPY A0-FX";

                  var 
                  len1 5;
                  var 
                  len2 30;

                  var 
                  vFast null;
                  var 
                  vSlow null;

                  function 
                  main {


                  timeframe close(sym(symbol "," interval)); 

                          if (
                  vFast == nullvFast ema(len1timeframe);
                          if (
                  vSlow == nullvSlow ema(len2timeframe);

                          
                  vFast getSeries(vFast);
                          
                  vSlow getSeries(vSlow);

                          
                  fast2 vFast.getValue(-1);
                          
                  slow2 vSlow.getValue(-1);

                          return new Array(
                  vFastvSlow);


                  My question is, using the above code, I am trying to retrieve the previous values (fast2 and slow2) so that i can calculate an increase/decrease differential on the MA's. Am i using the correct method to retrieve the PREVIOUS plotted values in real time?


                  Thanks
                  -=t

                  Comment


                  • #10
                    techlord
                    Yes you are.
                    Alex

                    Comment


                    • #11
                      Thanks alex!

                      Something else i noticed when i the previous code excerpt is that in the Global cursor window, cursor values are truncated to 2 decimal places.. Like this:

                      (im using the 5 min chart).


                      Any thoughts on why this is happening?

                      Comment


                      • #12
                        Sorry.. here is the image i wanted to attach.

                        i am simply using:

                        PHP Code:
                        function preMain() {

                            
                        setStudyTitle(title);

                            
                        setComputeOnClose();

                            
                        setCursorLabelName(interval " Min, (" len1 " EMA):"0);
                            
                        setCursorLabelName(interval " Min, (" len2 " EMA):"1);


                        Attached Files

                        Comment


                        • #13
                          techlord
                          That is happening because you are plotting those averages as a non price study which displays 2 decimals only by default. If you plotted them as a price study they would display in the same format as the symbol.
                          At this time it is not possible to define through efs the number of decimals displayed. You may want to submit a request for an enhancement by sending an email to [email protected].
                          In the mean time a solution is to multiply each returned element by a constant (for example 100).
                          Alex

                          Comment

                          Working...
                          X