Announcement

Collapse
No announcement yet.

EFS2: getSeries vs getValue

Collapse
X
 
  • Filter
  • Time
  • Show
Clear All
new posts

  • EFS2: getSeries vs getValue

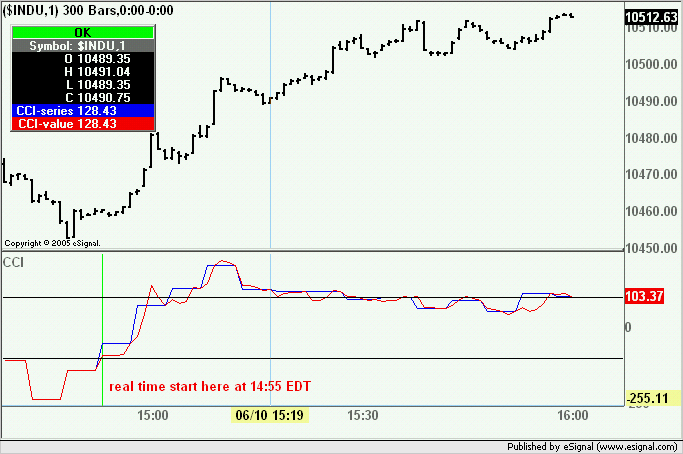
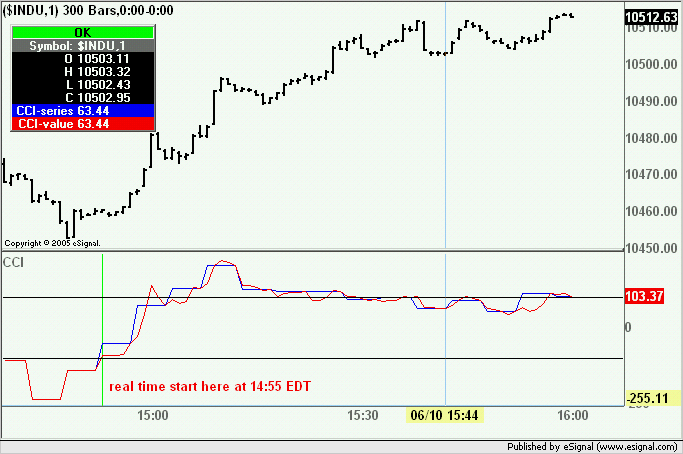
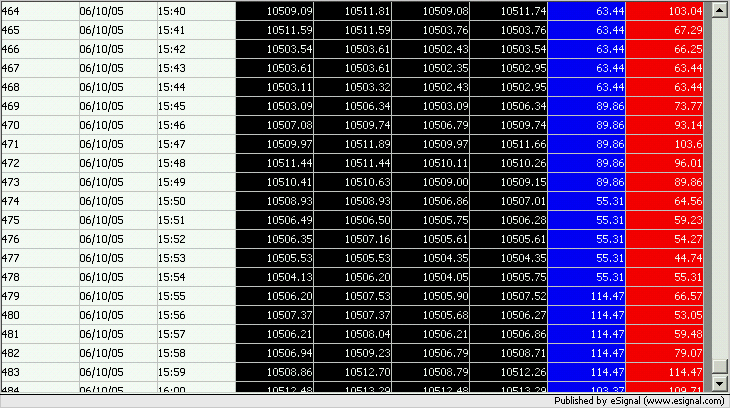
    Can anyone explain [in plain English, for a novice] the diferences between getSeries and study.getValue()?

    Based on documentation it should be none, but the results are diferent when plotting [last bar real time or not], so I need this clarification for other usages.

    Thank you.
    Mihai
    Mihai Buta

  • #2
    The only difference from a layman's point of view is if you are returning from main(). ie:

    return getSeries(something)

    or

    return something.getValue(0).


    Using getValue(...) will return the value no matter what.

    Using getSeries(...), the EFS engine will auto adjust the value to the last known value of that interval, if it's on a higher time frame. If you are on a 1 minute chart, and plotting 10 minute study data, the historical chart load will show a change in the 10 minute study data every 10 minutes, resulting in flat lines on your 1 minute chart, each of 10 minutes length. This is expected. Going forward, if you return a regular number (ie, from getValue() or others), it will plot in realtime, and will not have the flat lines of the historical load.

    In order to get the flat lines of the historical load, return the Series object directly (or use getSeries(...)). The engine will adjust the plot so that when you reload the EFS the realtime plots will have the 10 min flat lines like in the historical reload.

    Comment


    • #3
      Dion thank you,

      This means that one of them is incorrect, in real time.
      And I believe that that one is getValue, because [as told before] EFS2 engine re-computes the higher interval on every bar chart which, naturally, will return incorrect value until the high interval time is elapsed.
      Now everything makes sense, and that means that we need to keep track of real time vs histoeical data. In real time we cannot use getValue.

      Regards,
      Mihai
      Mihai Buta

      Comment


      • #4
        Mihai
        Sorry but you are mistaken.
        getValue() is always returning the correct value in real time and in fact the end point of the study will be exactly the same as the one returned by the series. The only difference is that the series constantly readjusts the values for the prior bars within the higher interval's time stamp (thereby creating the flat line even in real time) while the values plotted with getValue() will remain unchanged. This does not make them incorrect because they represent the higher interval's value at each instance of a lower interval bar.
        Alex.

        Comment


        • #5
          Alex is correct.

          As we've mentioned before, some traders want it one way (have the higher interval flat until the last bar, adjusted with getSeries()), other traders want it in realtime (with getValue()).

          This was what I pointed out to you in the other thread, it's up to you to decide how you want your data represented.

          Comment


          • #6
            Thank you guys,

            Finally this is english I can understand [it is my 3rd language, sorry].

            Now I understand that both are correct.
            Now I understand that getSeries does a setBar back to the time interval boundary and that this is the diference between them.

            Thank you.
            Miha
            Mihai Buta

            Comment


            • #7
              Hi,

              I plotted in real time the same indicator [CCI and Stochastics] with getValue and getSeries and getValue plots strange values between higher interval boundaries [values that have no apparent coherency with previous or next series value].

              As getValue cannot be trusted and getSeries does not allow to retrieve previous bars values, is the OffsetSeries a solution to retrieve previous values?

              Thank you.
              Mihai
              Mihai Buta

              Comment


              • #8
                Hi Mihai, I'll be looking into this tomorrow and will let you know what I find out.

                Thanks.

                Comment


                • #9
                  Thank you Dion,

                  Also observe the exact time higher interval indicators change value. If my observatiuon is correct, it changes one bar after the fact.

                  For example, on a 5min chart, 11:30 bar is a new bar for 5, 15 and 30 min, but 15 and 30 min indicators do not change until 11:35 bar. This is true for both getValue and getSeries and for historical data as well.

                  Thnak you,
                  Mihai
                  Mihai Buta

                  Comment


                  • #10
                    FWIW I am not seeing this.In the following images the cursor is set on the 11:30 bar and all the values are those of the corresponding bars on the higher intervals (30 in red and 15 in blue) and appear to have changed on that bar.
                    Alex

                    Comment


                    • #11
                      Mihai
                      I have run the following efs - which computes the CCI based on 5 min interval - on a 1 minute chart in real time from 14:55 EDT to the close of the trading day.

                      PHP Code:
                      function preMain() {
                          
                      setPriceStudy(false);
                          
                      setStudyTitle("CCI");
                          
                      setCursorLabelName("CCI-series"0);
                          
                      setCursorLabelName("CCI-value"1);
                          
                      setDefaultBarFgColor(Color.blue0);
                          
                      setDefaultBarFgColor(Color.red1);
                          
                      setPlotType(PLOTTYPE_LINE,0);
                          
                      addBand(100PS_SOLID1Color.black,"Upper");
                          
                      addBand(-100PS_SOLID1Color.black,"Lower");
                      }

                      function 
                      main() {

                          var 
                      cci(10,inv(5));

                          return new Array (
                      x,x.getValue(0));

                      The close of the higher interval occurrs on every lower interval bar that is time stamped nn:n4 and nn:n9. Those are the bars on which the value returned by getValue(0) is supposed to match that returned by the series.
                      For the following two images I picked two points at random on bars time stamped nn:n4 and nn:n9 and as you can see the values returned by getValue() are identical to those returned by the series as expected. FYI this happens at every instance when the bars are timed stamped as mentioned above.


                      Further to that I exported all the data using the Data Export tool which also includes the values returned by the efs


                      The data file was then imported into Excel where I added a conditional formatting to paint the values of the getValue cells when they were the same as the series cells. As you can see in the following image this happens on all historical bars while in real time it happens exactly at the bars with the appropriate time stamp. Again further proof that the value returned with getValue() is indeed correct.


                      Copy of the Excel worksheet and of the exported data file are in the attached zipped file.
                      Having gone through this I do not find your statement to be correct and would suggest that you review your code.
                      If your findings are different I would suggest that you post a complete series of facts that is at least as extensive as the one I have presented here. At this point I believe I have spent enough time verifying your unfounded statements about EFS2 problems to conclude that these are caused only by your improper usage of the code.
                      Alex


                      Originally posted by mbuta
                      Hi,

                      I plotted in real time the same indicator [CCI and Stochastics] with getValue and getSeries and getValue plots strange values between higher interval boundaries [values that have no apparent coherency with previous or next series value].

                      As getValue cannot be trusted and getSeries does not allow to retrieve previous bars values, is the OffsetSeries a solution to retrieve previous values?

                      Thank you.
                      Mihai
                      Attached Files

                      Comment


                      • #12
                        Alex,

                        1. You are right about changing at the right time. I don't know what I saw yesterday, because I looked many times.

                        2. I expect that getSeries and getValue return the same value on the time interval boundaries [they better do]. Between interval boundaries is the problem.
                        Note: As you can see in the picture attached, I have an emulation in EFS1 and for "mopving averages only" based intervals (moving averages, MACD, Osc, BB) the emulation is OK. For other indicators is not so OK [see CCI for example], but can lived with. The real problem is for indicators based on Wells Sum [RSI, ADX], where emulation produces an aberation.
                        For those indicators and for the fact that EFS2 "fills" the chart, I keep "bugging" you guys and I appologize and I thank you for putting up with me [stuborn perfectionist Virgo].

                        3. My last question was if OffsetSeries(-1) would return the previous higher interval value, because getValue9-1) does not.

                        Thank you,
                        Mihai

                        Mihai Buta

                        Comment


                        • #13
                          Mihai

                          2. I expect that getSeries and getValue return the same value on the time interval boundaries [they better do]. Between interval boundaries is the problem.

                          As explained in this post in this same thread the values "between interval boundaries" (to use your own definition) that are returned to the chart when using getValue(0) represent the higher interval's value at each instance of a lower interval bar.

                          3. My last question was if OffsetSeries(-1) would return the previous higher interval value, because getValue9-1) does not.

                          As stated several times already study.getValue(-1) will return the value at the prior bar of the higher interval (assuming the study is based on a higher interval). If you have evidence to the contrary post an efs example that shows that it does not. Note that it takes a very simple example similar to the one I posted earlier to verify this.
                          Alex

                          Comment


                          • #14
                            Alex,

                            2. ... the values "between interval boundaries" (to use your own definition) that are returned to the chart when using getValue(0) represent the higher interval's value at each instance of a lower interval bar.

                            I tried to make sense of it, but could not, so [at least for me] using it in real time is not an option [charts look like hell].

                            3. As stated several times already study.getValue(-1) will return the value at the prior bar of the higher interval (assuming the study is based on a higher interval). If you have evidence to the contrary post an efs example that shows that it does not. Note that it takes a very simple example similar to the one I posted earlier to verify this.

                            I asked the question [about using OffsetSeries(-1)] because I was told that the getValue(-1) refers to base interval [chart bars].
                            Now I verified and you are correct, it refers to the higher interval.

                            Thank you.
                            Mihai
                            Mihai Buta

                            Comment


                            • #15
                              Mihai

                              I asked the question [about using OffsetSeries(-1)] because I was told that the getValue(-1) refers to base interval [chart bars].

                              That is odd because I just went though every single thread in which you inquired about efs2 and the only posts I found on this subject are two replies of mine in which I clearly explain that study.getValue(-1) retrieves the value of the prior bar on the external interval (see here and here)
                              It would be helpful if you could provide the link to where that statement was made so that it can be corrected.
                              Alex


                              Originally posted by mbuta
                              Alex,

                              2. ... the values "between interval boundaries" (to use your own definition) that are returned to the chart when using getValue(0) represent the higher interval's value at each instance of a lower interval bar.

                              I tried to make sense of it, but could not, so [at least for me] using it in real time is not an option [charts look like hell].

                              3. As stated several time already study.getValue(-1) will return the value at the prior bar of the higher interval (assuming the study is based on a higher interval). If you have evidence to the contrary post an efs example that shows that it does not. Note that it takes a very simple example similar to the one I posted earlier to verify this.

                              I asked the question [about using OffsetSeries(-1)] because I was told that the getValue(-1) refers to base interval [chart bars].
                              Now I verified and you are correct, it refers to the higher interval.

                              Thank you.
                              Mihai

                              Comment

                              Working...
                              X