Announcement

Collapse
No announcement yet.

Questions about studies on studies in EFS2

Collapse
This topic is closed.
X
X
 
  • Filter
  • Time
  • Show
Clear All
new posts

  • Questions about studies on studies in EFS2

    Hi Alex

    Do you know if the "Draw Line Studies" will function on tick charts with EFS2??? Currently, as I'm sure you are aware, they do not work with tick data.

    Thanks
    Doug
  • #2
    Doug
    They now do
    Alex

    Comment


    • #3
      Alex

      Great!! Thanks for the info.

      RGDS
      DOug

      Comment


      • #4
        alexis,

        Looking over your documentation for the amStudies, you show two examples of retrieving a single value. The first example, it would appear that myLib.amLSMA() would be called every time a new tick arrives. In the second example, it would appear that myLib.amUpperk(), myLib.amMiddleK() and myLib.amLowerK() would only be called ONE time. When bInit is false.

        This second example seems to imply, to me, that EFS2 handles the calculation(s) automatically, internally. Could you discuss the pros and cons of the 2 different methods.

        thanks

        Comment


        • #5
          scjohn
          That is correct. In the first example the study is called on every tick and a single value is retrieved. In the second example instead the study is called only once when bInit is false and subsequently maintained by the formula engine.
          As to the pros and cons of each solution that may depend on what you are trying to accomplish.
          For example, if you need to use multiple values of the same study or need to plot the series to take advantage of the formula engine's synchronization (with multiple intervals/symbols) then the more efficient solution is to call the study once inside an Init condition or by writing if(nStudy==null) nStudy = amLSMA(param1,param2..) and then use the getValue() and getSeries() functions.
          If on the other hand you need a single value only under a specific set of conditions and do not wish/need to keep track of that study all the time then the better solution is to create that single value of the study when it is required.
          Hope this answers your question
          Alex

          Comment


          • #6
            alexis,

            You mentioned getSeries(). I am unable to find any documentation in the EFS2 Help document on this function. I looked for it in the Series Function section and it was not there. It does not appear in the index, either. Where is the documentation for getSeries()?

            Also, what is the effect of setComputeOnClose()? In the first example, will the formula engine respect the setting of true for all of the calculations done in the formula engine?

            thanks

            Comment


            • #7
              scjohn
              It has not yet been added to the EFS2 Help file which BTW can now be accessed directly from the Formula Editor. You should find it listed in the Toolbox under Data Series (if it is not in your current version it will be in the next installer)
              As to using setComputeOnClose() the formula will simply compute the values at every new bar. You can easily verify that running the enclosed example.
              If you have further questions regarding EFS2 you may want to post them in the EFS2 Development forum as this thread was only intended to showcase some of the new features of EFS2
              Alex

              PHP Code:
              function preMain() {
                  
              setPriceStudy(true);
                  
              setStudyTitle("SMA");
                  
              setCursorLabelName("SMA",0);
                  
              setComputeOnClose();
              }

              function 
              main() {

                  var 
              vMA sma(10,0);

                  return 
              vMA;

              Comment


              • #8
                Alexis,

                As you have coded many MA types I require some assistance to solve the problem I am experiencing with the attached script written in EFS2 format to try to emulate the built in ATR function as I require the functionality of both True Range and Wilders MA for use individually in other projects.

                The script works with no problems in the current timeframe but totally fails in accessing other timeframes and I don't know how to proceed further having tried many different methods with no success.

                Any help to resolve would be much appreciated.

                Robert
                Attached Files

                Comment


                • #9
                  Robert
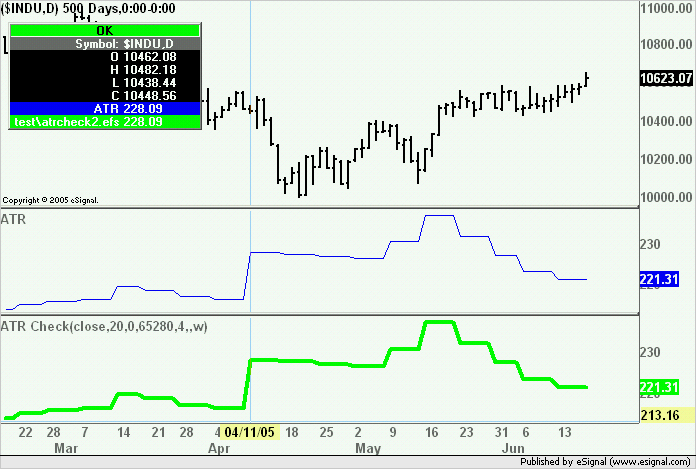
                  I believe the attached revision fixes the efs. In the image below you can see version 2 of your efs compared to the builtin customATR efs with both calculating the RSI on the weekly interval.
                  Hope this helps
                  Alex

                  Attached Files

                  Comment


                  • #10
                    Alexis,

                    Thanks for your help. I have a question and that relates to passing the parameters in vPlot, you have at the end sym(vSymbol) which does nothing in ATR function.

                    I have played with this and having it where you placed it is essential, however I don't really understand what is happening and why in ATR function putting the symbol there as in:-

                    xMAb = offsetSeries(eval(vMAb)(sym(symbol)),offset+1);

                    does not work.

                    Could you expand on this as I would like to get my head round this as I am still little confused how all the new capabilities regarding EFS2 Series works.

                    Robert

                    Comment


                    • #11
                      Robert
                      You control the context in which an external function (or efs) is executing by passing as the last parameter a series that contains the inv() or sym() series (the latter can also be expressed as a sym/inv combination). This occurrs even when the series that is being passed is not used within the external function (or efs) itself as is the case in my revision of the efs.
                      In that efs since I am creating the high, low and close series directly in the external function it is sufficient to pass the sym(vSymbol) parameter to have the ATR function run in the context of the symbol/interval that is being passed.

                      With regards to your specific example the parameter source in function ATR is already a sym/inv series so you would need to write the command as follows

                      xMAb = offsetSeries(eval(vMAb)(source),offset+1);

                      Another issue that needs to be considered in your original script is that offsetSeries() always runs in the context of the function in which it is used. So if offsetSeries() is in function main() it will run in the main chart's interval even if it relates to a study based on an external interval. If you want offsetSeries() to run in the context of the external interval you need to move it outside of main() and place it in the function that is running in the external interval (which you then control by passing an inv() or sym(sym/inv) series). This behavior may change somehow in the future but for now that is how it works.
                      Hope this helps
                      Alex

                      Comment


                      • #12
                        Alexis

                        I have coded the following script to perform drawing bands based on either ATR or high-low range using a flexible approach regarding the Basis source and MA as well as the MA used on the ranges out of which you can get Keltner(Hi-Lo)/Stoller(ATR) bands in their original format or a hybrid.

                        The problem I have encountered is concerning creating a series which fails in real time use when the Basis source is using built in MAs, Wilders works fine.

                        If I move the calculation of the bands within main() as I have done then everything works fine.

                        I would like to see and understand why my coding for the series which has been commented out at this time out does not work in real time.

                        Robert
                        Attached Files

                        Comment


                        • #13
                          Robert
                          As indicated in my prior reply if you want to control the context in which an external function (or efs) runs and you want the formula engine to maintain the syncronization for you (thereby avoiding the need to reload the efs when in real time) then you need to pass the series that contains the external interval/symbol as the last parameter.
                          In your script the last parameters of the efsInternal() calls to fnRngBnd are "U" and "L" whereas they should be either rBasG if you want to directly pass the study (which contains the inv/sym series) or sym(sSymIntG). You then need to rearrange the parameters in fnRngBnd(parameters) to match the order in which they are passed
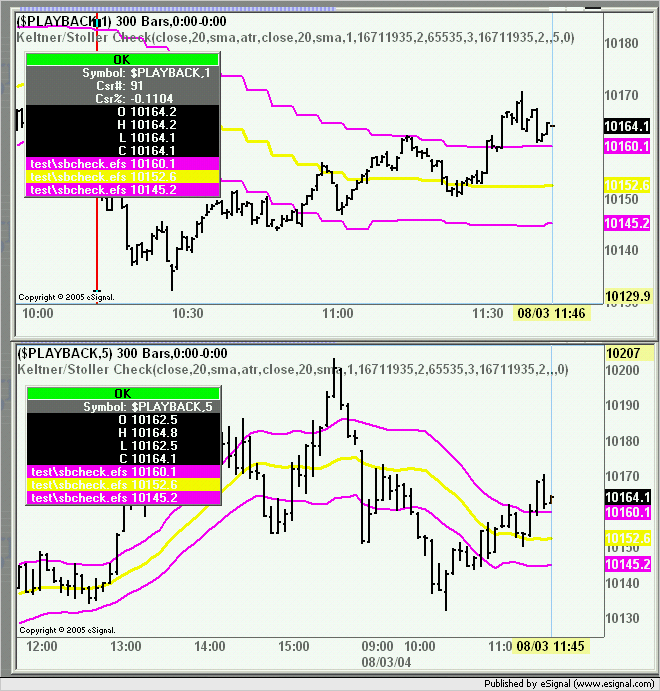
                          Once you implement either of these changes (the more efficient one being to pass the builtin study) then you should see the efs work correctly. In the images below the modified efs was run without reloading from the vertical red line visible in the 1 minute chart. As you can see the bands are syncronized to their equivalents in the 5 min chart
                          Also you may want to look at the keltner2.efs or machannel2.efs I posted here to see an example of how to take advantage of the enhanced functionality of efsInternal() available in 7.9.1 which allows you to retrieve through getSeries() a returned array. This would save you from having to make two efsInternal() calls in your efs.
                          Alex

                          Comment


                          • #14
                            Alex,

                            From a reply earlier this thread, looks like your aM studies can be accessed as simple functions, rather than data series.

                            Is this correct? Can they be accessed for one single value, without generating the entire series?

                            Thanks,
                            Mihai
                            Mihai Buta

                            Comment


                            • #15
                              Mihai
                              With the amStudies you can retrieve a single value just as with the builtin studies ie.
                              var vLSMA_2 = myLib.amLSMA(10,-2);
                              However the series is still generated and then cached
                              Alex

                              Comment

                              Working...
                              X