Announcement

Collapse
No announcement yet.

Opening Range Studies?

Collapse
X
 
  • Filter
  • Time
  • Show
Clear All
new posts

  • Opening Range Studies?

    Does anyone out there, Community or Esignal Community Support, know of any studies available that will draw horizontal lines indicating the Day's 5 and/or 30 minute Opening Range?

    If not, either I will have to learn how to create it myself or see if anyone out there would like to help.

    Thank you.

  • #2
    Hello KBtrader,

    Try the formula I posted in this thread.
    Jason K.
    Project Manager
    eSignal - an Interactive Data company

    EFS KnowledgeBase
    JavaScript for EFS Video Series
    EFS Beginner Tutorial Series
    EFS Glossary
    Custom EFS Development Policy

    New User Orientation

    Comment


    • #3
      Jason,

      Thanks. I'll try it.

      Comment


      • #4
        Jason,

        How can I change the formula to only draw the hi and lo for RTH's?

        I would also like to eliminate the Close line.

        I would also like the price of the hi and lo to appear in the right axis.

        Thanks

        Comment


        • #5
          Hello KBtrader,

          If you set your chart's time template to the RTH, the high low and close lines will reflect the RTH session.

          To remove the close line, comment out lines 57 and 58 with two forward slashes like below.


          To have the high and low values appear on the y-axis, you will have to return the values of vXHigh and vXLow in the return statement in main.


          You will also want to comment out the respective drawing commands in the same we did for the close. Also, keep in mind that these returned lines will differ from the drawn lines. This will happen because when an newer high or low is made within the specified window, the historical line will not automatically update to reflect the new value. You can do this within the EFS code using a for loop or while loop and the setBar() function.
          Jason K.
          Project Manager
          eSignal - an Interactive Data company

          EFS KnowledgeBase
          JavaScript for EFS Video Series
          EFS Beginner Tutorial Series
          EFS Glossary
          Custom EFS Development Policy

          New User Orientation

          Comment


          • #6
            EFS Help on Opening Range Study

            Jason,

            Thanks for the info regarding the the formula fixes for the OR study. I am a total novice at this, so I will see how the changes go. In the meantime, I have a Trade Station EDS study formula that does what I need.

            From what I've read on this website, Esignal has the capability of translating the EDS into EFS. If I send it to you, could you get it translated? Apparantly, this mssg board is unable to send an eds file. Do you have an email address I can send it to?
            Thanks.

            Keith

            Comment


            • #7
              Hello Keith,

              For custom development projects, we have a list of EFS Consultants available. Please contact them for pricing and availability.
              Jason K.
              Project Manager
              eSignal - an Interactive Data company

              EFS KnowledgeBase
              JavaScript for EFS Video Series
              EFS Beginner Tutorial Series
              EFS Glossary
              Custom EFS Development Policy

              New User Orientation

              Comment


              • #8
                30 MIN OR Study: To Jason

                Jason,

                I made the changes as you instructed, and it works well. There are just a few more things I'd like to modify.


                1. Could you give me instructions on how to change the thickness, color, and style of the High and Low Lines in this study?

                2. I would also like to have the color of the Value Box in the Y-Axis match the color of the line. Currently that color on both lines is blue.

                3. I would like to combine several studies into one formula, so that I don't have to add each formula to each chart. Do you have any instructions on how to do this?

                Thanks again.

                Keith

                PS. If the translation from the EDS to EFS is too difficult or time consuming, I seem to be doing fine with what you have provided. Especially, if I'll be able to make the other minor modifications. Thanks

                Comment


                • #9
                  Hello Keith,

                  1. The style, color and thickness are set by the specified parameters of the drawing functions. Please visit the following references from our EFS Knowledgebase for the various choices.

                  drawLineRelative( x1, y1, x2, y2, style, thickness, color [, tagID] )
                  drawTextAbsolute( barIndex, yValue, text, fgColor, bgColor, Flags, fontName, fontSize [, tagID] [, cx] [, cy] )

                  2. If you have added the return array from main(), then you need to add the setDefaultBarFgColor( color [, series] ) from the Utility Functions to preMain(). The optional series parameter is used to specify the return series to be colored. The first series returned by the return array from main() will have a series index of 0. The second series will have an index of 1 and so on.

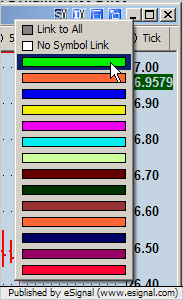
                  3. This can become a fairly complex task. There isn't a generic set of instructions to follow as it will become very specific to the number and type of studies you are trying to combine. As an alternative approach to save real estate in your charts, you could use the Stack Studies option for the non-price studies (Chart Options --> Stack Studies). For price studies, you could set up multiple charts with different sets of studies applied. You could then link those charts together using Symbol Linking, which is the little "S" icon in the upper right corner of the Advanced Chart.


                  Set the charts you want to be linked together by setting them to the same color. Whenever you change the symbol in one of those charts, the others will change as well. Then when you save your page or layout, all your formulas and charts will be saved as well. The next time you open eSignal your setup will still be the same and you won't have to re-apply all your formulas. To more quickly view a particular price-study, you would just go to the chart containing that study. Hope this helps give you some ideas how to manage your studies rather trying to combine them into a single formula.
                  Jason K.
                  Project Manager
                  eSignal - an Interactive Data company

                  EFS KnowledgeBase
                  JavaScript for EFS Video Series
                  EFS Beginner Tutorial Series
                  EFS Glossary
                  Custom EFS Development Policy

                  New User Orientation

                  Comment

                  Working...
                  X