 Tweet
Tweet
Hope this isn't a dumb question, but in all the multi-time frame examples I've seen posted, they all use either a minute, day, week, or month. Will the same functionality work with volume and tick time frames? and what would be the syntax? "500V"- for example for a 500 contract chart? tia
-
-
Snickers
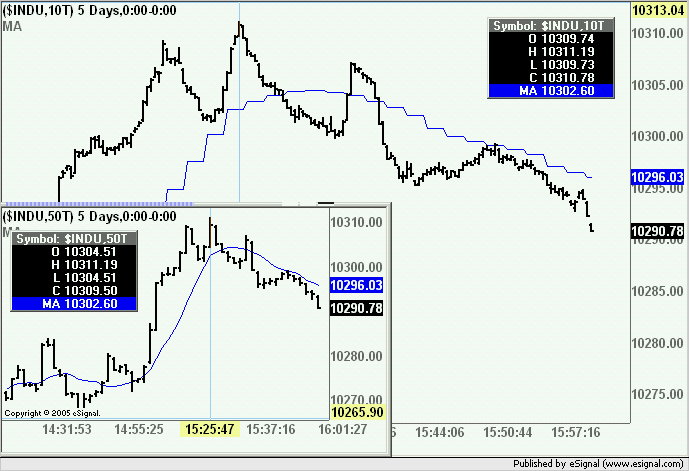
You can syncronize similar type tick-based charts (ie tick with tick, volume with volume etc). In the 10 tick chart below I am for example plotting a 10 period moving average based on 50 tick interval (shown for comparison purpose in the inset chart). The moving average study used is the customMA.efs which is in the EFS2 Custom folder
For the syntax of tick-based charts see this article in the eSignal KnowledgeBase
Alex
-
Alexis,
Thank you for responding.
Lets say for example that I wanted to use the new EFS2 CCI Built in study and within my efs for the 500 V chart I wanted to find the value of a 50 period CCI on a 1597V chart. Would I use the syntax:
if (study1 == null) study1 = new CCIStudy(50, "HLC/3", inv("1597V"), -1);
CCI1597 = study1.getValue(CCIStudy.CCI);
to get the last closed bar value from that time frame? I'm assuming, please correct me if I'm wrong, that the -1 would get me the last closed bar and 0 would get me the bar still in the process of being formed.
tiaComment
-
Snickers
In the example you posted you are using a mixture of EFS1 and EFS2 syntax.
Depending on what you want the correct syntax would be...
... or to access those same values directly ie without declaring the series using the followingPHP Code://to create the series
var myStudy = cci(50,hlc3(inv("1597V")));
//from which you can then retrieve the single values ie
var myValue_0 = myStudy.getValue(0);
var myValue_1 = myStudy.getValue(-1);
//where (0), (-1), etc are the values at the current and prior bar
//of the CCI on the external interval.
For the syntax of the all EFS2 functions, builtin studies, etc see the EFS2 Function Reference in the EFS KnowledgeBasePHP Code:var myCCI_0 = cci(50,hlc3(inv("1597V")),0);
var myCCI_1 = cci(50,hlc3(inv("1597V")),-1);
AlexComment
-
Alexis,
Well, I appreciate the help, but your documentation is a little sketchy.
On searching your documentation I could find no reference for "source" that would describe the syntax or the options the way it is defined in EFS (non-EFS2)
Please direct me to something with more information.
TIAComment
-
Snickers
Not sure what documentation of mine you are referring to. I directed you to eSignal's EFS KnowledgeBase.
Irrespective source can be any data series such as for example open(), high(), low() etc or a study series - builtin or custom - such as for example cci(10,rsi(14,high())) where high() is the source of the rsi() which in turn is the source of cci().
For the documentation on EFS builtin studies (not the EFS2 versions) see the EFS Function Reference at the same link I provided in my prior reply.
AlexComment
-
Alexis,
Its no big deal thanks to people like you I got what I needed and I really appreciate it.
Its just that I looked at everyone of the links you posted and never once did I see hlc3(). Now I admit I might have missed it, but since my search for source didn't yield anything either, I pretty much gave up. Also, the efs documentation doesn't use the object approach. The syntax is "HLC/3" I believe.
My request for more documentation was just in case you knew of some that provided more detail
Thanks again.Comment
-
Insert Chart Multiple tIME frames
Alexis,
This may be a bit off topic but in the post below, you are showing an "Insert Chart". Were you able to code this insert chart with efs2 or were did you simply cut and paste them together to show an example?
Thanks
-=terryComment
-
terry
That is just an Advanced Chart placed on top of another Advanced Chart
AlexComment
Comment