Announcement

Collapse
No announcement yet.

EFS to color chart backgrounds

Collapse
X
 
  • Filter
  • Time
  • Show
Clear All
new posts

  • EFS to color chart backgrounds

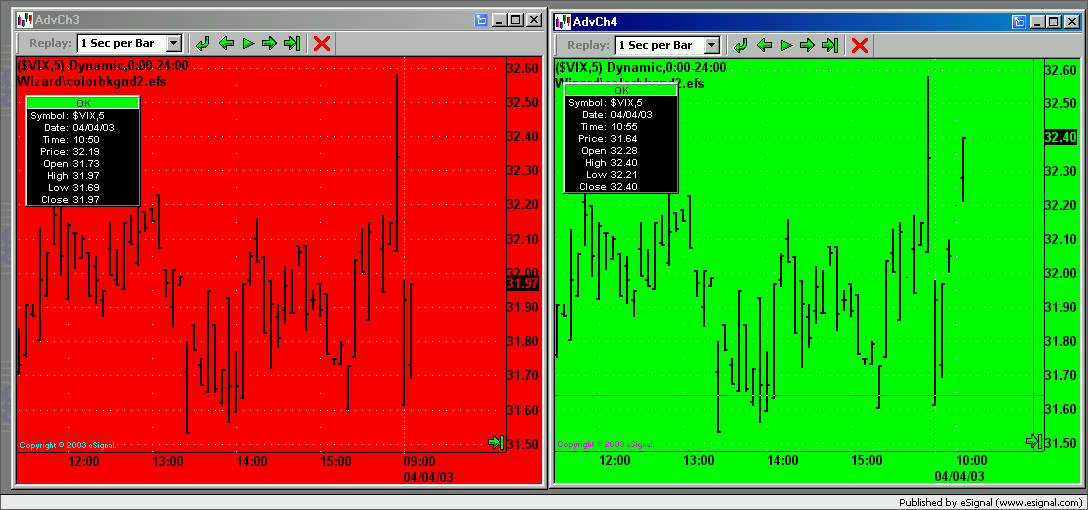
    I'm a programming rookie...been kinda of playing around with the following idea...but have not been able to make it work properly:

    on a 1min(or any timeframe) chart of say $TICK,

    -The chart background turns green if the last >= 200
    -The chart background turns yellow if the last is > -200, but < than 200.
    -The chart background turns red if the tick <= -200


    I'd be using a line on these charts, but if done with bars, it would need to be given consderation for the bar colors

    The idea is that I would apply the same idea to each of the $TICK, $TRIN, $TICKQ, etc etc..and would be able to glance at the charts, to get a feel for the market based on the color. of that indicator row of charts.

    Thanks for any help,

    cas

  • #2
    cas
    The attached efs colors the chart background depending on the conditions that you set in your message for $TICK.
    Create a 1 min (or other interval) chart of $TICK and run the script.
    You can go into Replay mode and see how the chart changes colors depending on where the close of the bar is.
    Note: You need build 564 or later to run this efs
    Alex
    Attached Files

    Comment


    • #3
      Awsome....and now I see what I was doing wrong..with mine. thanks!

      cas

      Comment


      • #4
        Works great...made diff EFS depending on the type of short-term indicator(TRIN, TICK, TICKQ, etc) What would be the easiest way to have it look at the change from the previous day (Change). Change does not seem to be supported. This would apply to the $VIX for example, where I would use the change on the day to look at bullishness/bearishness.

        thanks,

        cas

        Comment


        • #5
          cas
          You mean like this?


          If the current close is below yesterday's chart background is red, if above green.
          Attached is efs that does that.
          IMPORTANT NOTE: If you are using build 573 there is a known bug that will prevent this efs to show the results as in the above images.
          However if you remove (at least temporarily) the default.ach from the eSignal folder and then open a new chart AND do not use a Time Template then you will be able to see the changes in the chart's background color. A fix should be available in the next build.
          Alex
          PS. As you can see this is just a modified version of the prior script.
          Attached Files

          Comment


          • #6
            sort of...

            What I was getting at on the $vix is on the change from previous close::

            -Green if change <= -.80 (bullish)
            -Yellow if change > -.80 < .80 (mixed)
            -red if change >.80 (bearish)

            Thanks for all of your help..this is great,

            cas

            Comment


            • #7
              cas
              The attached efs will paint the background
              - green if current close is below yesterdays close -0.3
              - red if current close is above yesterday's close +0.3
              - yellow in between those values.
              You can obviously change the values to anything you prefer.
              Alex
              Attached Files

              Comment


              • #8
                Thank you very much for the help...these are great. The last one for the $VIX which uses the prevOHLC is not working....but I think that is because I'm having a problem with OHLC, pivotpoitns, etc as discussed in another thread.

                -cas

                Comment

                Working...
                X