Announcement

Collapse
No announcement yet.

Including other timeframes on the chart

Collapse
X
 
  • Filter
  • Time
  • Show
Clear All
new posts

  • Including other timeframes on the chart

    Jason K:

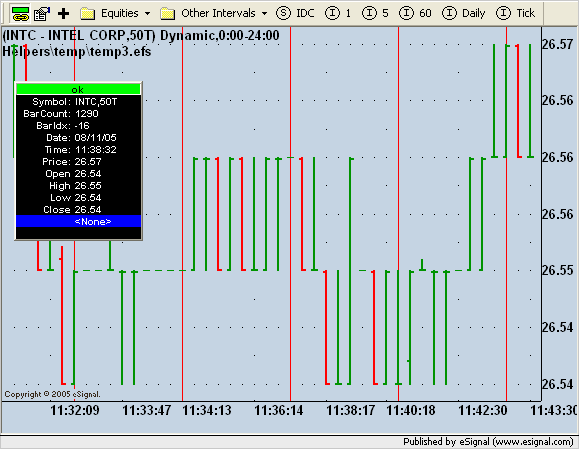
    I am looking for something that I can't find in the E-signal Forum, and was hoping you may have the solution someplace. With the custom ma indicator, I need to know how many bars until a new bar is formed. For example, on a 50 tick chart with a 450 tick custom MA - a new line is formed every 9 bars (50 tick bars). I am looking for something similar to a TIB (time in bar) counter, but just counts the bars formed. In the above example, the counter would count 1 thru 9, for each bar formed - then start over with 1 again. At the end of the ninth bar, a new line would appear on the customMA efs, and the counter would start over with 1. Hope I explained it well enough. Just a repeating 9 bar counter, etc...Thanks...
  • #2
    Hello jones,

    To get a bar count that resets every 9 bars you could simply create a global counter variable and increment this by 1 at each new bar by checking for the bar state with the getBarState() function. When the counter has exceeded 9, reset it to 1. The first time the counter is equal to 1, execute your code or draw your line. Try something like the following.


    PHP Code:
    var cntr 1;

    function 
    main() {
        if (
    getBarState() == BARSTATE_NEWBAR) {
            
    cntr++;
            if (
    cntr 9cntr 1;
        }

        if (
    cntr == && getBarState() == BARSTATE_NEWBAR) {
            
    // 9 50t bars have been completed
            // execute your code here
        
    }

    Jason K.
    Project Manager
    eSignal - an Interactive Data company

    EFS KnowledgeBase
    JavaScript for EFS Video Series
    EFS Beginner Tutorial Series
    EFS Glossary
    Custom EFS Development Policy

    New User Orientation

    Comment


    • #3
      bar count

      Jason - Thanks for the input. I tried what you suggested, but wasn't sure how to execute the code - or to write it exactly. I am using a 50 tick chart, and want to count 1 thru 9 - or just mark every 9th bar or every 450 ticks. Any more help would be greatly appreciated...

      Comment


      • #4
        Hello Jones,

        Please post your code so I can see what you're missing.
        Jason K.
        Project Manager
        eSignal - an Interactive Data company

        EFS KnowledgeBase
        JavaScript for EFS Video Series
        EFS Beginner Tutorial Series
        EFS Glossary
        Custom EFS Development Policy

        New User Orientation

        Comment


        • #5
          Bar Count...

          Jason:

          Here is the efs I am using. It seems to work fine - but is there a way to may the arrows larger, or perhaps use a verticle line? I would prefer a verticle line. Thanks

          Steve

          var cntr = 1;

          function main() {
          if (getBarState() == BARSTATE_NEWBAR) {
          cntr++;
          if (cntr > 9) cntr = 1;
          }

          if (cntr == 1 && getBarState() == BARSTATE_NEWBAR) {
          drawShapeRelative(-1,high(-1),Shape.UPARROW,"",Color.black,Shape.BOTTOM);

          // 9 50t bars have been completed
          // execute your code here
          }
          }

          Comment


          • #6
            Hello Jones,

            Use drawLineRelative() from 0 to positive infinity. Replace your drawShape call with something like below.

            PHP Code:
            drawLineRelative(000, (1*Infinity), PS_SOLID1Color.redrawtime(0)); 
            Jason K.
            Project Manager
            eSignal - an Interactive Data company

            EFS KnowledgeBase
            JavaScript for EFS Video Series
            EFS Beginner Tutorial Series
            EFS Glossary
            Custom EFS Development Policy

            New User Orientation

            Comment


            • #7
              Draw Shape

              Jason:

              I tried this but it didn't work...any ideas why?

              var cntr = 1;

              function main() {
              if (getBarState() == BARSTATE_NEWBAR) {
              cntr++;
              if (cntr > 9) cntr = 1;
              }

              if (cntr == 1 && getBarState() == BARSTATE_NEWBAR) {

              drawLineRelative(0, 0, 0, (1*Infinity), PS_SOLID, 1, Color.red, rawtime(0));

              //drawShapeRelative(-1,high(-1),Shape.UPARROW,"",Color.black,Shape.BOTTOM);

              // 9 50t bars have been completed
              // execute your code here
              }
              }

              Comment


              • #8
                Hello Jones,

                It's working on my end. Did you get a formula error? What version are you using?

                Jason K.
                Project Manager
                eSignal - an Interactive Data company

                EFS KnowledgeBase
                JavaScript for EFS Video Series
                EFS Beginner Tutorial Series
                EFS Glossary
                Custom EFS Development Policy

                New User Orientation

                Comment


                • #9
                  Jason - I didn't get an error - just didn't show any lines. I am on 7.9.1 E-signal...

                  Comment


                  • #10
                    Hello Jones,

                    Be sure that you saved the formula after making the changes. Then remove it from the chart and then reapply it. What symbol and interval are you using it with?
                    Jason K.
                    Project Manager
                    eSignal - an Interactive Data company

                    EFS KnowledgeBase
                    JavaScript for EFS Video Series
                    EFS Beginner Tutorial Series
                    EFS Glossary
                    Custom EFS Development Policy

                    New User Orientation

                    Comment


                    • #11
                      Jason, I got it to work by merging the study with prices...Any way I can get it to stand alone as a separate oscillator in another window pane?

                      Comment


                      • #12
                        Hello Jones,

                        If you have setPriceStudy(false) in preMain() it will draw the lines in the non-price window, but the study will also have to return something to create a scale. Try adding return sma(5) to the end of main.
                        Jason K.
                        Project Manager
                        eSignal - an Interactive Data company

                        EFS KnowledgeBase
                        JavaScript for EFS Video Series
                        EFS Beginner Tutorial Series
                        EFS Glossary
                        Custom EFS Development Policy

                        New User Orientation

                        Comment


                        • #13
                          Jason - that seemed to do the trick...Any idea of how to make the SMA invisible. I use a standard grey background? Thanks for your help. Much appreciated...

                          Comment


                          • #14
                            Hello Jones,

                            Change the color for the return value to the same color as your chart background using setDefaultBarFgColor(Color.grey, 0) in preMain or change the return value to a string using the .toFixed(2) method.

                            PHP Code:
                            return sma(5).toFixed(2); 
                            Jason K.
                            Project Manager
                            eSignal - an Interactive Data company

                            EFS KnowledgeBase
                            JavaScript for EFS Video Series
                            EFS Beginner Tutorial Series
                            EFS Glossary
                            Custom EFS Development Policy

                            New User Orientation

                            Comment


                            • #15
                              Hi Jason/Alex:

                              Is there a way to color the string returned by an EFS so that in the price label cursor tracking window that string would show up in a color of choice depending on its value? like other values on the chart whose color is based on the color definition of that particular study in the chart?

                              thnks,

                              ziggy

                              Comment

                              Working...
                              X