Announcement

Collapse
No announcement yet.

fib lines for day

Collapse
X
 
  • Filter
  • Time
  • Show
Clear All
new posts

  • fib lines for day

    I asked about this in the get studies but this may be more widely read.

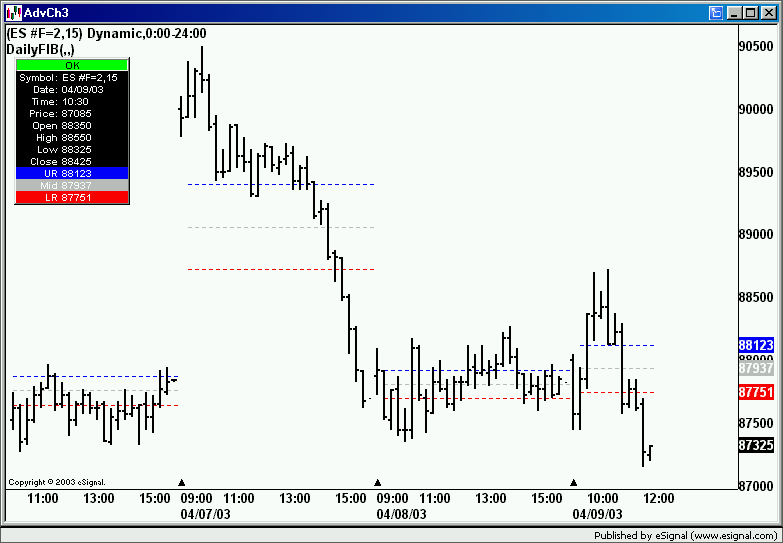
    I saw the midpoint of a donchian channel discussion by alex and I was wondering if there is a way to have that set up for an intraday chart but looking at it based on today's high and low.

    In other words how would you create a study that drew in the 38 50 and 62 fib line of the day on intraday charts.


    thanks
    john

  • #2
    John
    Attached is an adaptation of one of Jason's formulas that will plot 3 lines at 0.382, 0.500 and 0.618 of the Daily High and Low.


    If you want to change the Fib values go to Edit Studies and type the new values in the Get format (for example 0.236).
    Alex

    NOTE: This efs will not plot any lines if using build 573 specifically.
    Attached Files

    Comment


    • #3
      alex thanks but guess what build I am using. Is there a more current one now? Thanks

      Comment


      • #4
        John
        No, that is the latest available build.
        If in the mean time you would like to see the efs work you can always temporarily remove the default.ach file from your eSignal folder and then create a new chart.
        So long as you don't apply a Time Template this formula (and all the efs in the OHLC and Pivots folders) will work.
        Alex

        Comment


        • #5
          Neat little efs.

          Would it be possible to also include dynamic intraday fib lines? I mean for calculating the fib lines between certain periods of the day with time spans like an 30 minutes, hour, two hours, four hours, etc. in addition to the overall daily fib that you have? That way we could have fibs for the minor trends in addition to the major trend that would continuously update.

          Thanks!

          Comment


          • #6
            JT47319
            Not so sure I can do it, but there may be something that Garth posted a while back that might be of help. Will have to look for it and see if I can understand it in the first place and if it can be used/adapted for this task
            Otherwise I am afraid someone with more expertise will have to kick in.
            Alex

            Comment


            • #7
              Well whatever you can do would be great. I'm definitely glad that I signed up with eSignal since service and support have definitely been above average thanks in part to you guys.

              Comment


              • #8
                Hey, here's another suggestion: fibonacci time. Specifically the autoplotting, like the fib daily, of the high-low with time projections .236, .382, .5, .618, .786, 1, 1.236, 1.382, 1.5, 1.618, 1.786, 2.0 etc.

                Thx!!!
                Last edited by JT47319; 05-17-2003, 12:33 AM.

                Comment

                Working...
                X