Hello cv989,
Based on the information and code you have posted, it does not appear that you have read through the Guide to Developing EFS Indicators. If you are truly committed to learning EFS you should review this guide to gain an understanding of the EFS basics.
By the way, the formula you attached did not contain the code snippet you posted earlier today. If you put that code snippet inside main() and make the study a price study, you would get the result similar to the image I previously posted.
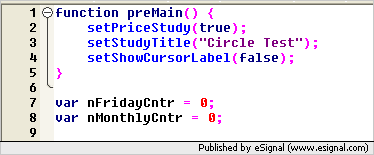
In the formula you just attached, the first thing you need to do is add the preMain() function and make the study a price study so that the circles will be drawn on the price window instead of the indicator pane. Add the following to the top of your study.

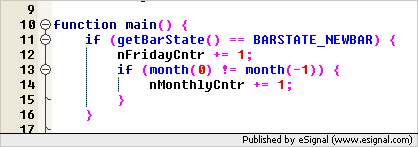
Next, add the following routine to the top of main(). This code block simply increments your image counters by a value of 1. The Friday counter increments at each new bar and the monthly counter increments at each new month. These counter variables will be used to create your unique tag names for the drawShapeRelative() calls.

Next, add the code snippet you posted earlier today for the Friday circles.

For the monthly circles, add the following code block. This is the same as what you had in your attached formula. I just moved the logic for incrementing the monthly counter to the top of main. Also, you can remove the last drawShapeRelative() call in your attached study. It was drawing a circle on every bar, which is not what you want.

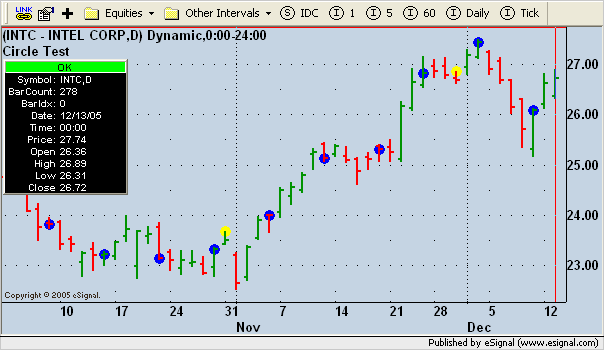
After you make these changes, you should see something like in the chart below.

If you continue to have trouble getting the formula to work, attach your latest version of the code and I'll provide additional guidance.
Based on the information and code you have posted, it does not appear that you have read through the Guide to Developing EFS Indicators. If you are truly committed to learning EFS you should review this guide to gain an understanding of the EFS basics.
By the way, the formula you attached did not contain the code snippet you posted earlier today. If you put that code snippet inside main() and make the study a price study, you would get the result similar to the image I previously posted.
In the formula you just attached, the first thing you need to do is add the preMain() function and make the study a price study so that the circles will be drawn on the price window instead of the indicator pane. Add the following to the top of your study.

Next, add the following routine to the top of main(). This code block simply increments your image counters by a value of 1. The Friday counter increments at each new bar and the monthly counter increments at each new month. These counter variables will be used to create your unique tag names for the drawShapeRelative() calls.

Next, add the code snippet you posted earlier today for the Friday circles.

For the monthly circles, add the following code block. This is the same as what you had in your attached formula. I just moved the logic for incrementing the monthly counter to the top of main. Also, you can remove the last drawShapeRelative() call in your attached study. It was drawing a circle on every bar, which is not what you want.

After you make these changes, you should see something like in the chart below.

If you continue to have trouble getting the formula to work, attach your latest version of the code and I'll provide additional guidance.


Comment