 Tweet
Tweet
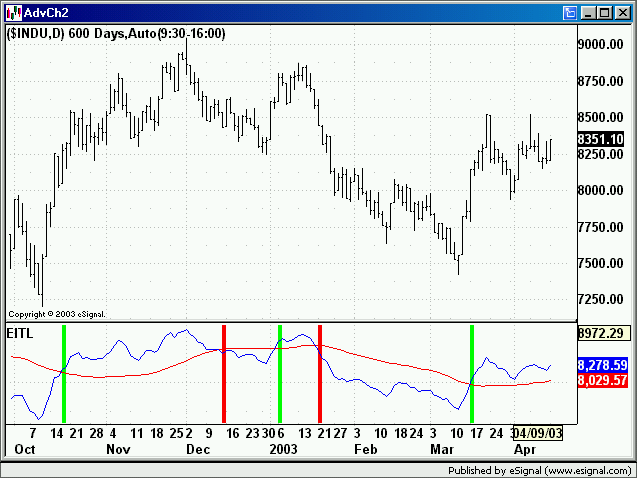
For the Ehlers ITL, I would like to have the background green in indicator screen when xover up, and background red in same screen when it xover down. Code is below.
Also, is there a $vix efs?
Thank you.
/**********************************************
Description : This Indicator plots the Ehlers Instantanaous Trend Line
Provided By : TS Support, LLC for eSignal
**********************************************/
function preMain(){
setStudyTitle("EITL");
setCursorLabelName("EITL",0);
setDefaultBarFgColor(Color.red,0);
setCursorLabelName("EITL",1);
setDefaultBarFgColor(Color.blue,1);
}
var InPhase_1 = 0;
var Quadrature_1 = 0;
var Phase_1 = 0;
var InstPeriod = 0;
var value5_1 = 0;
var value11_1 = 0;
Delta = new Array();
function main(){
var value1 = 0, value2 = 0, value3 = 0, value4 = 0, value5 = 0, value11 = 0, InPhase = 0, Quadrature = 0, Phase = 0, Deltaphase = 0, InstPeriod = 0, Trendline = 0, Period = 0;
if(getCurrentBarIndex() - getOldestBarIndex() > 5){
value1 = close() - close(-6);
value2 = close(-3) - close(-9);
value3 = .75 * (value1 - (close(-6) - close(-12)) ) + .25 * ( (close(-2) - close(-8)) - (close(-4) - close(-10)) );
InPhase = .33 * value2 + .67 * InPhase_1;
Quadrature = .2 * value3 + .8 * Quadrature_1;
//Use ArcTangent to compute the current phase
if(Math.abs(InPhase + InPhase_1) > 0)
Phase = Math.atan(Math.abs( (Quadrature + Quadrature_1) / (InPhase + InPhase_1) ));
//Resolve the ArcTangent ambiguity
if(InPhase < 0 && Quadrature > 0)
Phase = 180 - Phase;
if(InPhase < 0 && Quadrature < 0)
Phase = 180 + Phase;
if(InPhase > 0 && Quadrature < 0)
Phase = 360 - Phase;
//Compute a differential phase, resolve phase wraparound, and limit delta phase errors
DeltaPhase = Phase_1 - Phase;
if(Phase_1 < 90 && Phase > 270)
DeltaPhase = 360 + Phase_1 - Phase;
if(DeltaPhase < 1)
DeltaPhase = 1;
if(DeltaPhase > 60)
Deltaphase = 60;
//Sum DeltaPhases to reach 360 degrees. The sum is the instantaneous period
for(i = 40; i > 0; i--)
Delta[i] = Delta[i - 1];
Delta[0] = Deltaphase;
InstPeriod = 0;
Value4 = 0;
for(i = 0; i <= 40; i++){
value4 += Delta[i];
if(value4 > 360 && InstPeriod == 0)
InstPeriod = i;
}
//Resolve Instantaneous Period errors and smooth
if(InstPeriod == 0)
InstPeriod = InstPeriod_1;
value5 = .25 * InstPeriod + .75 * value5_1;
//Compute Trendline as simple average over the measured dominant cycle period
if(value5 < 0){
tmp = - value5;
Period = - Math.floor(tmp);
}
else
Period = Math.floor(value5);
Trendline = 0;
for(i = Period + 1; i >= 0; i--)
Trendline += close(-i);
if(Period > 0)
Trendline = Trendline / (Period + 2);
value11 = .33 * (close() + .5 * (close() - close(-3))) + .67 * value11_1;
}
if (getBarState() == BARSTATE_NEWBAR){
InPhase_1 = InPhase;
Quadrature_1 = Quadrature;
Phase_1 = Phase;
InstPeriod_1 = InstPeriod;
value5_1 = value5;
value11_1 = value11;
}
return new Array(Trendline,value11);
}
Comment