 Tweet
Tweet
I am wondering if there is a way to put indicators like $TICK and $TRIN at the bottom of a chart in separate panes like with oscillators. I use $TICK and $TRIN like oscillators when trading the S&P500 emini and would like to put them all on the same chart but not on top of each other. I really don't know where to look for a solution to this but eSignal support said this might be a good place to start. Any advice anyone may have would be greatly appreciated.
-
-
Hello trader_tim,
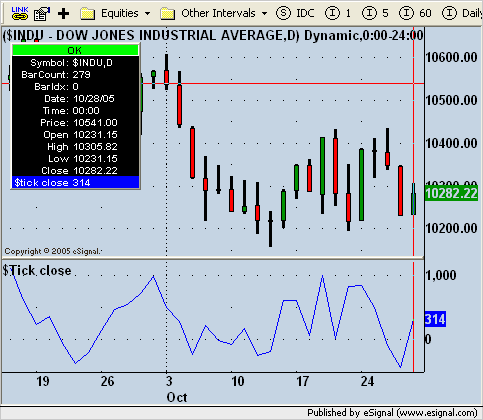
You can create a simple EFS study that returns the close of each symbol to the chart as a non-price study.
Create a separate study that uses the other symbol.PHP Code:function preMain() {
setStudyTitle("$Tick close");
setCursorLabelName("$tick close", 0);
}
function main() {
return close(sym("$tick"));
}
 Jason K.
Project Manager
eSignal - an Interactive Data company
EFS KnowledgeBase
JavaScript for EFS Video Series
EFS Beginner Tutorial Series
EFS Glossary
Custom EFS Development Policy
New User Orientation -
When you say close you mean that changes in the symbol used as an indicator (e.g. $TICK) only appear after the bar has closed?
The problem is I am a short term intraday trader that uses 3 minute charts and I would want the current bar's $TICK to show up on the screen as it fluctuates and is being calculated in the current bar - not after the bar is closed.
Is there any way to do this so that the current bar of the $TICK in the separate pane shows up as it is being calculated, rather than after it is calculated?
Thank you.
Originally posted by JasonK
Hello trader_tim,
You can create a simple EFS study that returns the close of each symbol to the chart as a non-price study.
Create a separate study that uses the other symbol.PHP Code:function preMain() {
setStudyTitle("$Tick close");
setCursorLabelName("$tick close", 0);
}
function main() {
return close(sym("$tick"));
}
Comment
-
Hello trader_tim,
The close series in EFS displays the close of the bar for the historical bars. In real time on the current bar the close series reflects the last price as it updates in real time. The example I gave you will do what you're asking for. Try it out to see it in action.Jason K.
Project Manager
eSignal - an Interactive Data company
EFS KnowledgeBase
JavaScript for EFS Video Series
EFS Beginner Tutorial Series
EFS Glossary
Custom EFS Development Policy
New User OrientationComment
Comment