Announcement

Collapse
No announcement yet.

Plotting Indicators on Price Charts

Collapse
X
 
  • Filter
  • Time
  • Show
Clear All
new posts

  • Plotting Indicators on Price Charts

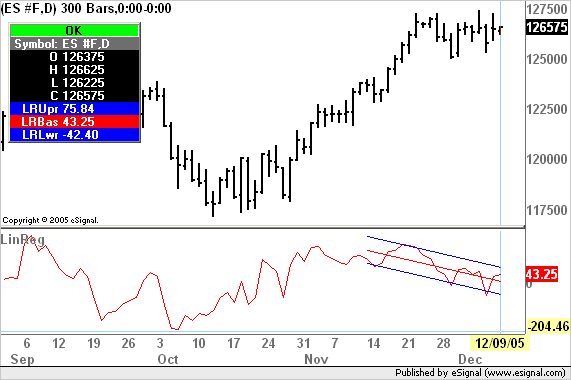
    Is there an EFS that will allow me to plot any indicator (for example the CCI), excluding price, on to a price chart? Additionally, can the plotted indicator be the data source for other indicators (for example a linear regression channel). Thanks!

    Kevin

  • #2
    Kevin
    If you want you can set up any efs to plot in the price chart. However it cannot replace the price series (even as a data source for other indicators) and will share the same scale as the price series.
    Having said that you can easily create formulas that are studies of studies where an indicator is the source of another indicator. In the image below you can see an example of the Linear Regression study that is set to use the CCI as its data source.
    Alex

    Comment


    • #3
      Could you please resubmit the pic (I don't see it)? Additionally, is there a boilerplate EFS that can be used to create a price study using another study/indicator as the data source? Another example: square of 9 levels based on the MACD.

      Comment


      • #4
        kevinclark
        You cannot see the image at this time because FileSharing (which is where the image is stored) is currently down. Once FileSharing goes back online you will be able to see the image again.
        I don't think there is an efs template set up to do what you asked however if you run some searches in the Bulletin Board you will find many examples of how to create studies of studies
        Alex

        Comment

        Working...
        X