Hi again,
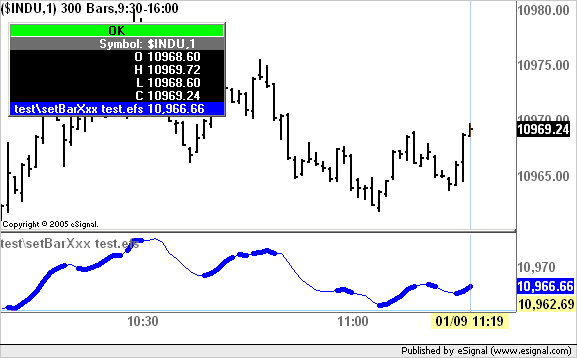
Is it me with my double-fast bar replaying computer or is there some reason my charts plot these values differently?
I notice the old style MA study matches the built-in study, but the new ema() function doesn't....
Thanks!
Is it me with my double-fast bar replaying computer or is there some reason my charts plot these values differently?
I notice the old style MA study matches the built-in study, but the new ema() function doesn't....
Thanks!


Comment