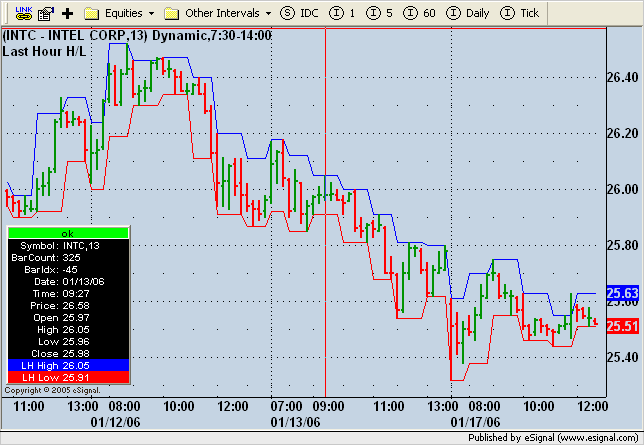
Okay, this may be a strange question, but I've gotta ask someone who has a little more experience than me.
I'm writing a program that's concerned with the way the market behaves for an hour at a time. More specifically, the high and the low during an hour. That's all fine and good and works perfectly if the chart I'm using breaks the bars up into a number that starts and ends on the hour.
Let me give an example to demonstrate my problem. Let’s say I'm using a 13 minute chart and I want the high and low between 11:00 and 12:00. The nearest bar to 11:00 is actually 11:03 and the nearest to 12:00 is actually 12:08. And let’s say that at 12:05 the stock actually went higher than it had been for the whole previous hour, but I don't want that value because I'm only interested in the values between 11:00 and 12:00. (The same problem happens at the beginning as the end of the hour).
So I'm wondering if there's anyway to break down the time, no matter what chart I'm on, and only use the values in the time frame that I'm concerned with.
Thanks for any ideas.
ALP


Comment