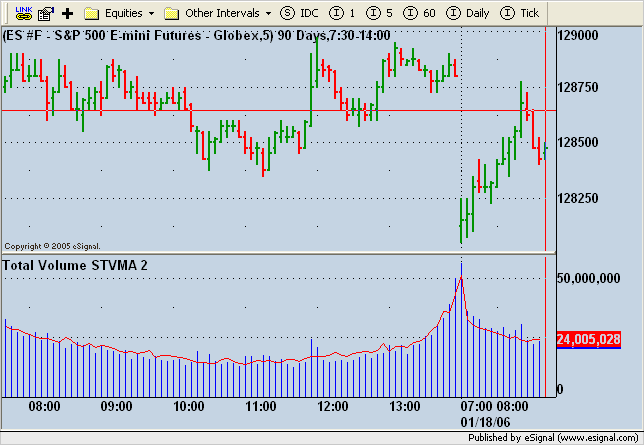
I modified a script posted by Chris Kryza here to calculate $TVOL same-time moving average. The idea is to evaluate market participation at any point of the day relative to longer term VMA.
The attached EFS calculates $TVOL current bar volumes and plots an histogram for those volumes plus a VMA line for same-time bars over a certain number of periods specifieds in the parameters list. All the values used in the formula are extracted from symbol $TVOL, regardless of the symbol used in the main chart.
The EFS seems to work fine, except when the symbol in the price study pane is ES #F. Then the 9:30 bar doesn't match the time shown on the X axis. Any idea why this is happening?
I am using a custom time template set to EST equity hours (9:30-16:00) and 63 days of data.

Comment