Announcement

Collapse
No announcement yet.

wrong EMA display

Collapse
X
 
  • Filter
  • Time
  • Show
Clear All
new posts

  • wrong EMA display

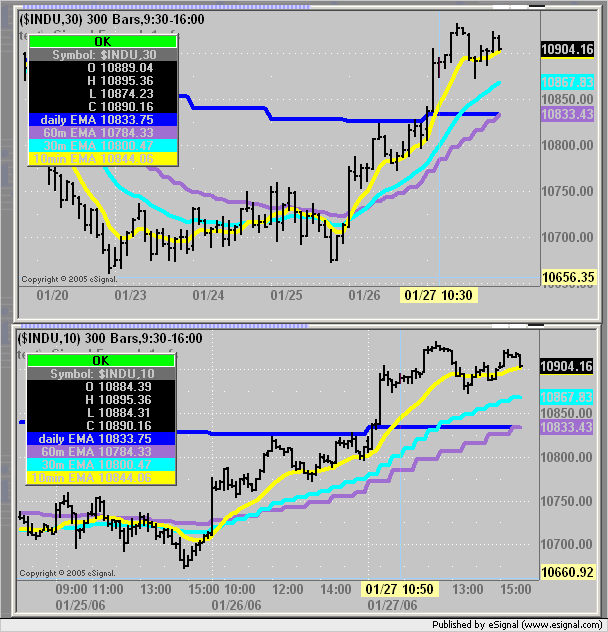
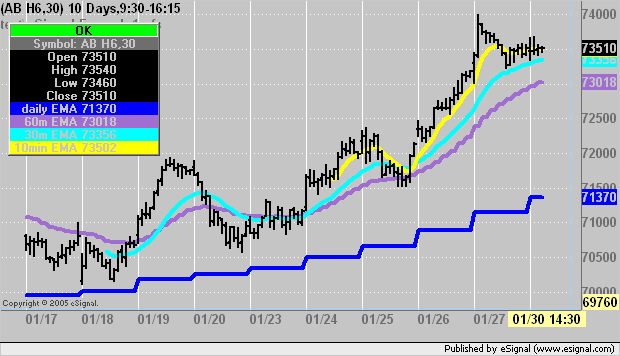
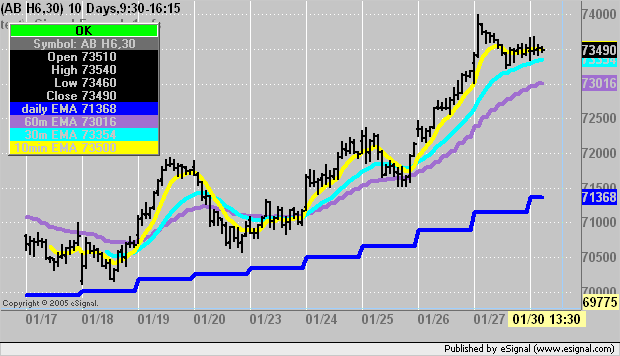
    When I plot below 4 EMAs (10, 30, 60, Daily) on a 30min chart. The 20period 10min EMA is distorted. Would someone pls advise why?


    var EMA_Interval_1 = 10;
    var EMA_Interval_2 = 30;
    var EMA_Interval_3 = 60;
    var EMA_Interval_4 = "D";
    var nMALength = 20;

    function preMain()
    {
    setPriceStudy(true);
    setCursorLabelName("daily EMA",0);
    setDefaultBarThickness(4,0);
    setDefaultBarFgColor(Color.blue,0);
    setCursorLabelName("60m EMA",1);
    setDefaultBarThickness(4,1);
    setDefaultBarFgColor(Color.purple,1);
    setCursorLabelName("30m EMA",2);
    setDefaultBarThickness(4,2);
    setDefaultBarFgColor(Color.cyan,2);
    setCursorLabelName("10min EMA",3);
    setDefaultBarThickness(4,3);
    setDefaultBarFgColor(Color.yellow,3);

    }

    function main()
    {
    vEMA1 = ema(nMALength, inv(EMA_Interval_1));
    vEMA2 = ema(nMALength, inv(EMA_Interval_2));
    vEMA3 = ema(nMALength, inv(EMA_Interval_3));
    vEMA4 = ema(nMALength, inv(EMA_Interval_4));

    return new Array (vEMA4, vEMA3, vEMA2, vEMA1);
    }
    Last edited by Richard Yu; 01-28-2006, 05:44 AM.

  • #2
    Richard
    That may be due to the fact that you do not have enough 10 min data to compute the historical values of the 10 min EMA when using a higher interval chart. You either need to increase in the Time Template the number of days loaded for that interval or add a setIntervalsBackFill(boolean) statement in preMain(). For more information on setIntervalsBackfill see the EFS2 Function Reference in the EFS KnowledgeBase
    Alex

    Comment


    • #3
      I hv added setIntervalsBackfill(true) but the EMA is still distorted... Pls advise. thx.

      var EMA_Interval_1 = 10;
      var EMA_Interval_2 = 30;
      var EMA_Interval_3 = 60;
      var EMA_Interval_4 = "D";
      var nMALength = 20;

      function preMain()
      {
      setIntervalsBackfill(true);
      setPriceStudy(true);
      setCursorLabelName("daily EMA",0);
      setDefaultBarThickness(4,0);
      setDefaultBarFgColor(Color.blue,0);
      setCursorLabelName("60m EMA",1);
      setDefaultBarThickness(4,1);
      setDefaultBarFgColor(Color.purple,1);
      setCursorLabelName("30m EMA",2);
      setDefaultBarThickness(4,2);
      setDefaultBarFgColor(Color.cyan,2);
      setCursorLabelName("10min EMA",3);
      setDefaultBarThickness(4,3);
      setDefaultBarFgColor(Color.yellow,3);

      }

      function main()
      {
      vEMA1 = ema(nMALength, inv(EMA_Interval_1));
      vEMA2 = ema(nMALength, inv(EMA_Interval_2));
      vEMA3 = ema(nMALength, inv(EMA_Interval_3));
      vEMA4 = ema(nMALength, inv(EMA_Interval_4));

      return new Array (vEMA4, vEMA3, vEMA2, vEMA1);
      }

      Comment


      • #4
        Richard
        As far as I can tell it is returning the correct values.
        Alex

        Comment


        • #5
          I hv tried again and it still doesn't work.

          If I open another 10min chart and set it to dynamic, my 30min chart is showing the 10min EMA correctly.

          So your explanation is correct but somehow your solution doesn't work on my side.....

          Comment


          • #6
            Richard
            That may be due to how the Time Template is set up. You may want to post an image of the Time Template that is being used when you get the incorrect values.
            Also consider the following. When you are plotting a lower interval study on a higher interval chart the value used to plot the study on the higher interval chart.will be the last calculated value within the higher interval's time segment So, if you are using a 30 minute chart and plotting a 10 min average you need to look at the value of the last 10 min bar within the 30 minute segment. For example the value of the 10 min EMA at the 10:30 bar on the 30 min chart will be that of the 10:50 bar on the 10 min chart because that is the last known value for that segment of time. Similarly on the 12:00 bar of the 30 min chart the value that will be plotted is that of the study at the 12:20 bar on the 10 min chart
            Alex

            Comment


            • #7
              Richard
              For more information on Time Templates and how to use them see this article in the eSignal KnowledgeBase
              Alex

              Comment


              • #8
                I am using 3 charts for the same symbol:
                30min chart (9:30-16:15)
                10min chart (9:30-16:15)
                10min chart (24hr)

                So the 30min chart is "reading" from the 10min (24hr) instead of 10min (9:30-16:15) chart and thus mess the chart up???

                Comment


                • #9
                  Richard
                  You may want to read the article on Time Templates I indicated earlier.
                  If that does not resolve the issue please post an image of the Time Template used in the 30 minute chart
                  Alex

                  Comment


                  • #10
                    1) Below is the time template of my 30min chart:


                    2) BTW, which one of below is more cpu-efficient (I understand that the 2 different approaches will show different values but I want to know which one will cost me less CPU power).

                    i) my code shown in previous msg
                    ii) below code:
                    var e1=null;
                    var bInit=false;
                    var EMA_Interval_1 = 10;
                    var EMA_Interval_2 = 30;
                    var EMA_Interval_3 = 60;
                    var EMA_Interval_4 = "D";

                    function main() {

                    if (!bInit) {
                    e1 = ema(20, inv(EMA_Interval_1));
                    e2 = ema(20, inv(EMA_Interval_2));
                    e3 = ema(20, inv(EMA_Interval_3));
                    e4 = ema(20, inv(EMA_Interval_4));
                    bInit-true;
                    }

                    vEMA1 = e1.getValue(0);
                    vEMA2 = e2.getValue(0);
                    vEMA3 = e3.getValue(0);
                    vEMA4 = e4.getValue(0);

                    more calculation here...

                    }

                    3) My setup is as follows:
                    i) open 2 instances of eSignal
                    ii) 1st eSignal: 4 symbols, each with 3charts of different time frames, each with 20EMAs of 10min, 30min, 60min, daily on it.
                    iii) 2nd eSignal: 4 symbols, each with 2 charts (daily, weekly), each with 20EMAs of daily and weekly on it.

                    So same EMAs are plotted many times in different time-frame. Will this drain a lot of computer resources or it is ok since eventually only a few EMAs are calculated (even though they are plotted several times in different time frames)??
                    Last edited by Richard Yu; 01-28-2006, 09:18 PM.

                    Comment


                    • #11
                      Richard
                      1) The setIntervalsBackfill() function uses the settings of the main interval and applies them to the external interval if these are set differently. For this to work though the definitions of the various intervals need to be set as #Days or alternatively as Dynamic and not #Bars.
                      Following is an example of how setIntervalsBackfill() works when different #Days are applied in the Time Template to the different intervals.
                      In the first image is the Time Template I will be using in the chart. Notice that I am loading 10 days of 30 min data and setting the 10 min interval to load only 5 days.


                      I then modified your original script and commented out setIntervalsBackfill() which is the same as setting it to false. Here is the resulting chart. Notice that the 10 min EMA plots over 5 days only.


                      Following is the same chart with setIntervalsBackfill() enabled.


                      As you can see despite the fact that the Time Template is set to load only 5 days of 10 min data the script requests the same number of days used for the higher interval.
                      2) The script you posted in the last message will use less resources because it does not maintain constant synchronization of the plot(s). You may want to read through this post which explains what happens when computing a study on external intervals and returning the value instead of the series.
                      3) As far as I know eSignal does not recommend running multiple instances of the application
                      Alex

                      Comment


                      • #12
                        So there are 3 approahes:
                        i)
                        main() {
                        vEMA1 = ema(20, inv(interval1));
                        return vEMA1
                        }

                        ii)
                        main() {
                        if(e1==null) e1=ema(20, inv(interval1));
                        return e1.getValue(0);
                        }

                        iii)
                        main(){
                        if(e1==null) e1=ema(20, inv(interval1));
                        return getSeries(e1);
                        }

                        i) and ii) are what I hv shown earlier and iii) is mentioned in the link you gave. And i) is less cpu-intensive as you advised.... But are i) and iii) the same??? Is iii) more efficient since ema() is declared just once upon loading the chart while i) will run ema() upon each tick??
                        Last edited by Richard Yu; 01-30-2006, 09:26 AM.

                        Comment


                        • #13
                          Also, for my setup,
                          3) My setup is as follows:
                          i) open 2 instances of eSignal
                          ii) 1st eSignal: 4 symbols, each with 3charts of different time frames, each with 20EMAs of 10min, 30min, 60min, daily on it.
                          iii) 2nd eSignal: 4 symbols, each with 2 charts (daily, weekly), each with 20EMAs of daily and weekly on it.

                          So if I already hv a 10min 20period EMA plotted on one chart.... what will the ADDITIONAL cpu/memory burden will be like if I show the same EMA on 2 other charts of different interval??? Will it be minimal since it is plotted on another chart anyway OR it will triple the cpu/memory burden??

                          For the question above, will the answer be different if the charts are loaded in 2 different instances of eSignal??

                          Comment


                          • #14
                            Richard
                            I don't believe I indicated that i) uses less resources than ii) rather the opposite.
                            As to your examples i) and iii) are functionally the same in as much as they both return a series but iii) is slightly more efficient because the formula engine does not need to verify that an instance of that study has already been created as it is declared as a global variable. All it needs to do is retrieve the series that is cached at the time the study is initialized.
                            Alex

                            Originally posted by Richard Yu
                            So there are 3 approahes:
                            i)
                            main() {
                            vEMA1 = ema(20, inv(interval1));
                            return vEMA1
                            }

                            ii)
                            main() {
                            if(e1==null) e1=ema(20, inv(interval1));
                            return e1.getValue(0);
                            }

                            iii)
                            main(){
                            if(e1==null) e1=ema(20, inv(interval1));
                            return getSeries(e1);
                            }

                            i) and ii) are what I hv shown earlier and iii) is mentioned in the link you gave. And i) is less cpu-intensive as you advised.... But are i) and iii) the same??? Is iii) more efficient since ema() is declared just once upon loading the chart while i) will run ema() upon each tick??

                            Comment


                            • #15
                              Richard
                              With regards to running multiple instances of eSignal see this article in the eSignal KnowledgeBase
                              Alex

                              Originally posted by Richard Yu
                              Also, for my setup,
                              3) My setup is as follows:
                              i) open 2 instances of eSignal
                              ii) 1st eSignal: 4 symbols, each with 3charts of different time frames, each with 20EMAs of 10min, 30min, 60min, daily on it.
                              iii) 2nd eSignal: 4 symbols, each with 2 charts (daily, weekly), each with 20EMAs of daily and weekly on it.

                              So if I already hv a 10min 20period EMA plotted on one chart.... what will the ADDITIONAL cpu/memory burden will be like if I show the same EMA on 2 other charts of different interval??? Will it be minimal since it is plotted on another chart anyway OR it will triple the cpu/memory burden??

                              For the question above, will the answer be different if the charts are loaded in 2 different instances of eSignal??

                              Comment

                              Working...
                              X