Announcement

Collapse
No announcement yet.

EFS questions by shaeffer

Collapse
X
 
  • Filter
  • Time
  • Show
Clear All
new posts

  • EFS questions by shaeffer

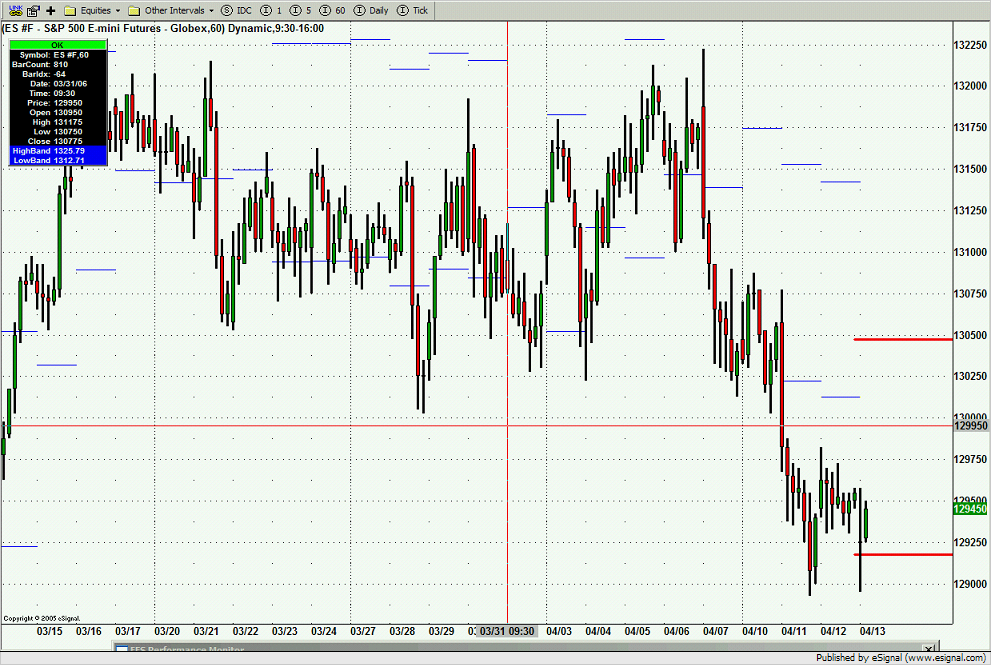
    I have an efs where a background color change occurs in an intraday chart when the close(0) is near yesterdays high +/- a value delta. In the efs, under function main() is
    PHP Code:
    var delta open(0)*.005
    This is so the delta is proportional if used in a chart of the $SOX ~ 525 or a chart of QLGC ~ 20.

    My question is: will the value of delta be calculated at every tick, even though it is a constant all day? If so, is there a way to calculate this once only, and is it remembered the rest of the day?

    Thanks
    shaeffer

  • #2
    Hi shaeffer,

    I believe the this thread can provide you with some help. Regardless, based on your question, I think you already know the answer is yes, it will run every tick. Now, to make sure it is not evaluated on every tick, there are a number of ways to do that. The most foolproof, which is probably the best for you, is to test for a change in day in addition to the use of making the delta variable a global variable and setting it to null (set outside main).

    I believe one of these two will work for you ...

    PHP Code:
    // global variable
    var delta null;

    // test in main
    if((day(0) != day(-1)) || (isLastBarOnChart() && delta ==null)){
     
    delta high(-1inv("D"))

    - or -

    PHP Code:
    // global variable
    var delta null;

    // test in main
    if((day(0) != day(-1)) || (delta ==null)){
     
    delta high(-1inv("D"))

    Comment


    • #3
      Hi Steve,

      The wording in my last question was not clear, and your reply woke me up to a mistake I had made. That previous line should have been (and is now)
      PHP Code:
      var delta open(0,inv("D")) * .005 
      Yesterdays high is defined elsewhere in the efs. The delta sets the band on either side of the high where I want the color change to occur. So if the open today is 30, delta would be 0.15 and if yesterdays high was 32, the color change should occur when close(0) is between 31.85 and 32.15.

      So, given that the open today is constant, after the first calc, delta is a constant also for the day. But if open(0,inv("D")) is 'looked up' on every tick to recalculate delta, that's a waste of processor power (that adds up).

      I'll read the link you provided, so I'll better understand global variables.

      Regards
      shaeffer

      Comment


      • #4
        Presently I have a simple EFS used in an intraday chart, where after the preMain stuff are two lines:
        PHP Code:
        function main(){
        return 
        open(0inv("D"));

        I think it is because the "open" command is located after function main, that it gets (needlessly in this application) calculated on every tick?

        If instead, after preMain, I have the lines:
        PHP Code:
        var openToday;

        function 
        main(){
        openToday open(0inv("D");
        return 
        openToday;

        will that calculate the open only once (and plot it throughout the day) on my intraday chart?

        Thank you
        shaeffer

        Comment


        • #5
          Hi shaeffer,

          So you are using a separate stand alone efs to accomplish this? While simple, that in itself is not very efficient. Perhaps we should create a separate function you can call for this. Let me know what you want to do here. Meanwhile, I suggest that you take a look at this to see if that is of assistance.

          Comment


          • #6
            Hello shaeffer,

            Both of your code examples will be executed on every tick. The most efficient way to accomplish what you want is to create a Series of the Daily open prices and then just plot the current value of that series. The initialization of the Series only needs to be done once. Try the example below.

            PHP Code:
            var xOpenToday null;

            function 
            main(){
                if (
            xOpenToday == nullxOpenToday open(inv("D"));
                return 
            xOpenToday.getValue(0);

            Jason K.
            Project Manager
            eSignal - an Interactive Data company

            EFS KnowledgeBase
            JavaScript for EFS Video Series
            EFS Beginner Tutorial Series
            EFS Glossary
            Custom EFS Development Policy

            New User Orientation

            Comment


            • #7
              Hi Jason,

              I am trying to understand what makes your way more efficient.

              First, is this how an EFS progresses thru the lines of code?
              1. when first loaded, the efs reads everything above main(),
              2, then unless restarted, the efs code is read from main() thru to return, then back to main() thru to return, over and over again (but never re-reads above main())?

              If that is correct, then the line var xOpenToday = null; is read once only at startup. Then the if statement condition is true only the very first time it is read, at which time xOpenToday becomes today's open value, and is never recalculated (or is retrieved the better word?).

              If all the above is correct, I see the efficiency in having the one time only calculation (retreival) of the open value.

              Will this efs still go endlessly from main() to return to main() to return ..... for every tick, but just nothing happens in each cycle except for plotting the open on the chart?

              Why can't the final line simply be return xOpenToday; ?
              I suspect the answer is related to your reference to creating a series. In the EFS Developers Reference it says use getSeries() to assure that the actual series is being returned, rather than the values but I don't understand the distinction?

              Is your suggestion what Steve meant by creating a separate function? I am definitely looking for the most efficient way to run an efs. Although the example here is simple, I am running many efs's in many charts, to the point that the program bogs down in fast markets. Although my other efs's appear to be working ok, they also may be running very inefficiently, so I am hoping to apply the learnings here to my other efs's.

              Your help is much appreciated gentlemen.

              Regards
              shaeffer

              Comment


              • #8
                Hello shaeffer,

                Originally posted by shaeffer
                Hi Jason,

                I am trying to understand what makes your way more efficient.

                First, is this how an EFS progresses thru the lines of code?
                1. when first loaded, the efs reads everything above main(),
                2, then unless restarted, the efs code is read from main() thru to return, then back to main() thru to return, over and over again (but never re-reads above main())?
                We have a tutorial that explains this in detail. See section 4 in Tutorial 1: EFS Basics and Tools.

                If that is correct, then the line var xOpenToday = null; is read once only at startup. Then the if statement condition is true only the very first time it is read, at which time xOpenToday becomes today's open value, and is never recalculated (or is retrieved the better word?).
                Correct, the if statement is true only once and therefore it's corresponding code executes only once. At that instance, xOpenToday becomes a Series Object that contains all the daily open prices that correspond to each bar in your chart. Once the Series Object is created, it will contain all the daily open prices that correspond to the days in your chart. It will not be reinitialized again on the next execution of main().

                If all the above is correct, I see the efficiency in having the one time only calculation (retreival) of the open value.

                Will this efs still go endlessly from main() to return to main() to return ..... for every tick, but just nothing happens in each cycle except for plotting the open on the chart?
                Remember that xOpenToday stores a series of values, not a single value. You use the .getValue(-barIndex) method to extract a specific value from that series.

                You are correct that main() will execute on every tick in real time, but the xOpenToday series is already initialized. All that main() does at that point is return the current value of the Series to the chart.

                Why can't the final line simply be return xOpenToday; ?
                I suspect the answer is related to your reference to creating a series. In the EFS Developers Reference it says use getSeries() to assure that the actual series is being returned, rather than the values but I don't understand the distinction?
                You can if you are creating the Series Object on every tick, but that is less efficient.

                PHP Code:
                function main(){
                    var 
                xOpenToday open(inv("D"));
                    return 
                xOpenToday;

                When you use the method I showed you, the Series Object is only being created once. That is more efficient, but if you then try to return the Series Object variable, xOpenToday, by itself, the EFS2 engine cannot determine your intentions so it returns the first value of the series. The first value in the series is the oldest day's open in this case. You need to specify which bar index you want to plot in the return statement or wrap the Series Object variable inside the getSeries() function. Try the following.

                PHP Code:
                var xOpenToday null;

                function 
                main(){
                    if (
                xOpenToday == nullxOpenToday open(inv("D"));
                    return 
                getSeries(xOpenToday);


                Is your suggestion what Steve meant by creating a separate function? I am definitely looking for the most efficient way to run an efs. Although the example here is simple, I am running many efs's in many charts, to the point that the program bogs down in fast markets. Although my other efs's appear to be working ok, they also may be running very inefficiently, so I am hoping to apply the learnings here to my other efs's.

                Your help is much appreciated gentlemen.

                Regards
                shaeffer
                I'm not completely sure what Steve intended to do. It is certainly possible to move the logic into a separate function. There are many ways to accomplish the same task in a programming environment. Many times the difference is simply user preference.
                Jason K.
                Project Manager
                eSignal - an Interactive Data company

                EFS KnowledgeBase
                JavaScript for EFS Video Series
                EFS Beginner Tutorial Series
                EFS Glossary
                Custom EFS Development Policy

                New User Orientation

                Comment


                • #9
                  Hi shaeffer,

                  Originally posted by shaeffer
                  ...
                  Is your suggestion what Steve meant by creating a separate function? I am definitely looking for the most efficient way to run an efs. Although the example here is simple, I am running many efs's in many charts, to the point that the program bogs down in fast markets. Although my other efs's appear to be working ok, they also may be running very inefficiently, so I am hoping to apply the learnings here to my other efs's.
                  I had earlier coded what I believe you wanted and included all of the repetitive calculations in a function that only gets called from main once per day, thus ensuring minimal resource usage. Feel free to modify it as you see fit.
                  PHP Code:
                  /***********************************************
                  Provided By : Steve Hare  Â© April 2006                          
                  EFS Formula : sBands.efs                  
                  Version 1.0
                  4/13/2006

                  The bands are determined based on yesterdays high and todays open
                  Requested by shaeffer
                  */


                  function preMain() {
                   
                  setPriceStudy(true);
                   
                  setCursorLabelName("HighBand",0);
                   
                  setCursorLabelName("LowBand",1);
                   
                  setStudyTitle("sBands");
                  }

                  function 
                  main() {
                  // test in main
                   
                  if((day(0) != lastday)){
                    
                  lastday day(0);
                    
                  sBands(.005);
                   }
                   return new Array(
                  HighBand,LowBand);
                  }

                  // global variable for function
                  var todaysHighBand null;
                  var 
                  todaysLowBand null;
                  var 
                  sNum 0;
                  var 
                  firstIndex=0;
                  var 
                  HighBand=null;
                  var 
                  LowBand=null;
                  var 
                  lastday null;

                  function 
                  sBands(tmp){
                   if (
                  todaysHighBand!=null){ //this means there was a line previously
                    //var rNum = sNum-15;
                    //removeLineTool( LineTool.SEGMENT, "hi"+rNum );
                    //removeLineTool( LineTool.SEGMENT, "lo"+rNum );
                    
                  addLineToolLineTool.SEGMENTfirstIndextodaysHighBandgetCurrentBarIndex(), todaysHighBand1Color.blue"hi"+sNum );
                    
                  addLineToolLineTool.SEGMENTfirstIndextodaysLowBandgetCurrentBarIndex(), todaysLowBand1Color.blue"lo"+sNum );
                    
                  sNum++;
                   }
                   
                   
                  firstIndex getCurrentBarIndex();
                   
                  yesterdayHigh high(-1inv("D"));
                   var 
                  delta open(0inv("D"))*tmp;
                   
                  todaysHighBand yesterdayHigh+delta;
                   
                  todaysLowBand yesterdayHigh-delta;
                   
                   
                  removeLineToolLineTool.RAY"high1" );
                   
                  removeLineToolLineTool.RAY"low1" );
                   
                   
                  addLineToolLineTool.RAYfirstIndex-1todaysHighBand,  firstIndextodaysHighBand3Color.red"high1" );
                   
                  addLineToolLineTool.RAYfirstIndex-1todaysLowBand,  firstIndextodaysLowBand3Color.red"low1" );
                   
                   
                  HighBand todaysHighBand.toFixed(2);
                   
                  LowBand todaysLowBand.toFixed(2);

                  I had done this earlier today and had uploaded it to my fileshare area in this folder. Since you indicated you use it in many charts, I made it as efficient as I could, short of limiting the number of historical lines created on the chart. If you choose to implement that, simply un-comment out those three steps in the external function I created (only do that if you have more than 15 days of data on the chart).

                  Here is a screenshot:


                  Originally posted by stevehare2003

                  if((day(0) != day(-1)) || (delta ==null)){
                  As an aside, I had previously shown you how to discern a change of days. This was incorrect, sorry for the mistaken advice. Please look at the method I used in the efs posted above as the correct way to determine a day change.

                  Finally, I have one more recommendation for you as an area of study, and that is the efs javascript video series here. Should you try and figure out what I am doing in the efs, please feel free to ask questions after you have reviewed the Debugging section at this link and have thouroughly evaluated how the efs works using the methods described in that lesson and the tips I added below. IMHO, many of the questions you have been asking will be answered if you follow the techniques and recommendations contained in that lesson, not only for determining where the errors are in your code, but as an aid to figure out how your efs is executing. As an addendum to this lesson, I have found it beneficial when using debugPrintln to always include the line number where the particular debugPrintln statement is. It is also helpful to include the barcount as well in at least one of the debugPrintln statements. I use these methods as a matter of course in my work and they are a tremendous help for troubleshooting or simply trying to figure out program flow. For example...

                  PHP Code:
                  debugPrintln("13:  barCount = "+getCurrentBarCount() +" otherstuff = "+othervariable); 
                  Finally, several precautions should be made regarding the use of debugPrintln. First, it expends resources. Use this feature minimally while you are actively trading. Secondly, the more text that is contained in the formula output window, the more resources that are used. Therfore, you should either manually clear the window periodically by right clicking and selecting clear, or, alternately using the debugClear() command in your efs, as outlined in the referenced lesson.

                  I hope this is helpful.

                  Comment


                  • #10
                    Thank you for the replies Steve and Jason. To make sure I now understand the basics, I'm responding here just to Jason's reply. I reviewed the Tutorial you suggested Jason, as well as the other three in the series, and finally completed the last of Jay's video's.

                    I applied the format from your previous suggestion to the attached efs to plot the daily 50sma on a 15 minute chart. It seems that on line 12 'var sma50' could eventually become a single value, a string, a series or other things .... but when line 12 is read, that is not known (and doesn't matter)?

                    Then line 16 is when var sma50 becomes a series, simply because the right side of the '=' is a series? And so line 18 returns (plots) the latest value of that series.

                    As an example, last Wednesday, YHOO closed with a daily sma50 = 32.02. Throughout the day on Thursday, should that plot have stayed at 32.02, based on Wednesday's daily close? In other words, the efs would not have recognized the intraday Thursday changes in YHOO's prices, but would only have used the Wed close price to plot the 50sma? Would the series automatically update at midnight Thursday night to add the new (latest) value to the series based on Thursday's close? or if I did not shutdown and restart my computer since Thursday morning (or reload the efs), would the series never update?


                    I notice that the sma50 gets plotted for previous days (not just the latest). So it seems that the 'if' logic in main() does not apply during the initial loading of the chart and efs? Rather, as each historic bar loads, the sma50 series is built based on the close of the previous day?

                    I think I understand this now... I'll know for sure based on your answers.

                    Regards
                    shaeffer

                    P.S. Instead of attaching the efs to this note, can the efs text be pasted into the PHP entry line?
                    Attached Files

                    Comment


                    • #11
                      Well, I was wrong in at least one respect in that last efs. I have an equivalent efs for the daily 10ema in a 15 minute chart, and I see it is updating as the day progresses (not a flat line). So it seems the series is updating based on the Last price today (as opposed to updating at the end of today based on the close today), despite the if statement!!??

                      I guess I need to plot the ema10.getValue(-1) value in the return line. But that still leaves the question... based on the Last price today, is the final (today's) value in the series updating continuously (and using CPU resources)?

                      Regards
                      shaeffer
                      (I notice the upcoming (5th) Tutorial is about Series.. I'll be watching for that)

                      Comment


                      • #12
                        Hello shaeffer,

                        Originally posted by shaeffer
                        Thank you for the replies Steve and Jason. To make sure I now understand the basics, I'm responding here just to Jason's reply. I reviewed the Tutorial you suggested Jason, as well as the other three in the series, and finally completed the last of Jay's video's.

                        I applied the format from your previous suggestion to the attached efs to plot the daily 50sma on a 15 minute chart. It seems that on line 12 'var sma50' could eventually become a single value, a string, a series or other things .... but when line 12 is read, that is not known (and doesn't matter)?
                        Correct, it doesn't matter at that point. This just sets up the variable as a global variable so that it will persist between executions of the formula.


                        Then line 16 is when var sma50 becomes a series, simply because the right side of the '=' is a series? And so line 18 returns (plots) the latest value of that series.
                        Correct.

                        As an example, last Wednesday, YHOO closed with a daily sma50 = 32.02. Throughout the day on Thursday, should that plot have stayed at 32.02, based on Wednesday's daily close? In other words, the efs would not have recognized the intraday Thursday changes in YHOO's prices, but would only have used the Wed close price to plot the 50sma? Would the series automatically update at midnight Thursday night to add the new (latest) value to the series based on Thursday's close? or if I did not shutdown and restart my computer since Thursday morning (or reload the efs), would the series never update?
                        What you are referring to is a synchronized plot. As your code is currently, the current day's plot will not be a flat line (synchronized) across all the bars on your 15-min chart as the formula runs in real time. To force the plot to back adjust the plot so that all the bars on the 15-min chart reflect the most recent value of the daily sma you need to wrap the Series Object variable with the getSeries() function.

                        PHP Code:
                        var sma50 null;

                        function 
                        main(){
                            if(
                        sma50 == null){
                                
                        sma50 sma(50inv("D"));
                            }
                            return 
                        getSeries(sma50);


                        I notice that the sma50 gets plotted for previous days (not just the latest). So it seems that the 'if' logic in main() does not apply during the initial loading of the chart and efs? Rather, as each historic bar loads, the sma50 series is built based on the close of the previous day?
                        The if() statement will execute if it's specified condition evaluates to true, which only happens on the very first execution of the formula. That instance is at the very first bar in the chart, or the oldest bar index. Once a Series Object is initialized it will contain all the corresponding calculations it needs. After that point, your formula code only needs to reference the specific data you want with the .getValue() method.

                        I think I understand this now... I'll know for sure based on your answers.

                        Regards
                        shaeffer

                        P.S. Instead of attaching the efs to this note, can the efs text be pasted into the PHP entry line?
                        Yes, that is what I used in the code examples I have posted for you. Simply surround your code that you paste into your reply with the [ php] // your code [ /php] tags. Just leave out the spaces.
                        Jason K.
                        Project Manager
                        eSignal - an Interactive Data company

                        EFS KnowledgeBase
                        JavaScript for EFS Video Series
                        EFS Beginner Tutorial Series
                        EFS Glossary
                        Custom EFS Development Policy

                        New User Orientation

                        Comment


                        • #13
                          Originally posted by JasonK

                          What you are referring to is a synchronized plot. As your code is currently, the current day's plot will not be a flat line (synchronized) across all the bars on your 15-min chart as the formula runs in real time. To force the plot to back adjust the plot so that all the bars on the 15-min chart reflect the most recent value of the daily sma you need to wrap the Series Object variable with the getSeries() function.
                          PHP Code:
                          var ema10 null;

                          function 
                          main(){
                              if(
                          ema10 == null){
                                  
                          ema10 ema(10inv("D"));
                              }
                          return 
                          ema10.getValue(0); 
                          Hi Jason, you are right, the above formula did not produce a flat line in the current day. But I thought that if the efs was loaded first thing in the morning, ema10 was a fixed series with the latest value based on yesterday's close, and that the series could not change because of the if statement. If that is correct, then ema10.getValue(0) must not be getting that constant last value of the series?

                          Even if the efs is loaded mid-market day, because of the (inv"D"), would the last value in the series still be based on yesterday's close?

                          So what is ema10.getValue(0) plotting.... a daily or chart interval ema10? When I changed it to ema.getValue(-1), I did get the flat line plot of yesterdays ema value I expected, but is that more processor intensive than your suggestion (i.e. is it still doing a real time ema calc for today that just isn't plotted)?

                          Your suggestion to use getSeries(sma10) looks like the series would be retreived on every tick, but in fact it 'knows' just to get the latest value from the series defined after the if statement?


                          The if() statement will execute if it's specified condition evaluates to true, which only happens on the very first execution of the formula. That instance is at the very first bar in the chart, or the oldest bar index. Once a Series Object is initialized it will contain all the corresponding calculations it needs. After that point, your formula code only needs to reference the specific data you want with the .getValue() method.
                          Oh, so if the chart happens to be loading 10 days of 15 minute bar data, all the data up to the most current day is retreived into the series when the first 15 minute bar, 10 days ago is loaded?

                          Aggghhh! I was starting to conclude that I should use getSeries(), then you closed the last paragrapg with .getValue(). Can you clarify which should be used and when? I notice both are used in the xOpenToday examples in earlier notes in this thread.


                          Yes, that is what I used in the code examples I have posted for you. Simply surround your code that you paste into your reply with the [ php] // your code [ /php] tags. Just leave out the spaces.
                          Strange, on my trading computer, the Paste command will not appear when I right-click in a forum note. I am typing this on my older computer, where the Paste command does appear. Maybe an internet explorer setting difference?

                          Regards
                          shaeffer

                          Comment


                          • #14
                            Hello,
                            This is getting to be a long thread. I hope this summarizes the options and outstanding questions.

                            Option 1 - return getSeries(sma50);
                            I changed the return line last night to return getSeries(sma50); and I am getting a flat line intraday plot today, with a value different from the sma based on the close yesterday. So I assume that the intraday close of each 15 minute bar is being 'seen' and used to recalculate and update todays flat line plot. So is there any purpose/benefit (in terms of CPU loading) of the if statement, if the series is being updated and the sma recalculated throughout the day?

                            Option 2 - return sma50.getValue(0);
                            Instead of a flat line plot, I get a curve plot, otherwise I think the sma is still being recalculated based on 15 minute closes? So I'm guessing this option is no less processor intensive than option 1? Or maybe this is just a tiny bit less CPU intensive, because unlike option 1, this does not go back and replot the whole line for the day based on the latest value?

                            Option 3 - return sma50.getValue(-1);
                            In this case I get a flat line plot today, based on yesterdays close. Here I can understand the purpose/benefit of the if statement (assuming the efs is still not seeing and processing the 15 minute closes - is it?). If it is not, then I could see how this would be less CPU intensive.
                            --------------------------------------------------------
                            I beleive I know graphically now (as described above) the difference between each return command. I would like to know which is least and most processor intensive. And in options 1 and 2 it is still a mystery to me what the purpose of the if statement is (which I beleive loads the entire series when the earliest bar of the chart is first loaded) if the series is being continuously updated throughout the day anyway?

                            I hope I don't seem obsessed with this, but I think it is a core concept that I need to understand. So I appreciate your patience.

                            Regards
                            shaeffer

                            P.S. If there is a draft of the next efs tutorial (#5) on Series available, I would be happy to review it and return comments from the end-user perspective.

                            Comment


                            • #15
                              Hello shaeffer,

                              Originally posted by shaeffer
                              PHP Code:
                              var ema10 null;

                              function 
                              main(){
                                  if(
                              ema10 == null){
                                      
                              ema10 ema(10inv("D"));
                                  }
                              return 
                              ema10.getValue(0); 
                              Hi Jason, you are right, the above formula did not produce a flat line in the current day. But I thought that if the efs was loaded first thing in the morning, ema10 was a fixed series with the latest value based on yesterday's close, and that the series could not change because of the if statement. If that is correct, then ema10.getValue(0) must not be getting that constant last value of the series?

                              Even if the efs is loaded mid-market day, because of the (inv"D"), would the last value in the series still be based on yesterday's close?

                              So what is ema10.getValue(0) plotting.... a daily or chart interval ema10?
                              The series only needs to be initialized once. Once it has been initialized it will contain all of the daily ema values including the current days daily value. As the price continues to change throughout the day, the current daily value of the series also updates. This update is being handled by the Series Object in the background essentially. Your efs code does not do the calculating for this value, it only retrieves the values as you need them for plotting or other calculations that your code may need to perform. When you plot the .getValue(0) of the ema series you are plotting the current daily value. The last value of the series is not based on yesterday's close, it's based on the current day's close or last traded price.

                              When I changed it to ema.getValue(-1), I did get the flat line plot of yesterdays ema value I expected, but is that more processor intensive than your suggestion (i.e. is it still doing a real time ema calc for today that just isn't plotted)?
                              When you plot the .getValue(-1) value of the series you are plotting yesterday's (i.e. bar index -1 of the dialy chart) ema value, which no longer is updating because it's related price data is now historical. It is no more processor intensive than plotting .getValue(0). However, if you do not need to plot the current day's ema value of the series you can simply retrieve the prvious day's ema value directly and plot it. There is no need for a series object in that case, which is more efficient. Try the following.

                              PHP Code:
                              function main() {
                                  return 
                              ema(10inv("D"), -1);


                              Your suggestion to use getSeries(sma10) looks like the series would be retreived on every tick, but in fact it 'knows' just to get the latest value from the series defined after the if statement?
                              Yes, the value of the series is being retrieved every tick, which needs to occur if you are plotting the current day's value because it will potential change on every tick. Don't get too hung up on the if() statement. That is just used as the method to allow the Series to only be initialized one time. Again, the current day's value of the series is being updated by the EFS2 engine for you. That's a built-in behavior of the Series Object.

                              Oh, so if the chart happens to be loading 10 days of 15 minute bar data, all the data up to the most current day is retreived into the series when the first 15 minute bar, 10 days ago is loaded?
                              Essentially, yes.

                              Aggghhh! I was starting to conclude that I should use getSeries(), then you closed the last paragrapg with .getValue(). Can you clarify which should be used and when? I notice both are used in the xOpenToday examples in earlier notes in this thread.
                              The name of this function is somewhat confusing because it is an overloaded function. It is also used to extract a series from a return array of Series Objects returned from an efsInternal() or efsExternal() call. When used in the return statement as in our example, it is simply telling the EFS2 engine that you want to see a synchronized plot of the specified series. The only thing extra it adds to the processing is the back-adjusting of the plot for the current day's bars. You only need to use it if you initialize an external time frame Series Object once through a routine like I've showed you with the if() statement and are only plotting the 0 index value of the series. The .getValue() method is just simply used to retrieve the specified index values from the series when ever you need them.


                              Strange, on my trading computer, the Paste command will not appear when I right-click in a forum note. I am typing this on my older computer, where the Paste command does appear. Maybe an internet explorer setting difference?

                              Regards
                              shaeffer
                              Sounds like there was nothing copied to your clip board. To paste, you can also use Ctrl-V on the keyboard. If there was anything in your clip board it will get pasted to the form.


                              Hello,
                              This is getting to be a long thread. I hope this summarizes the options and outstanding questions.

                              Option 1 - return getSeries(sma50);
                              I changed the return line last night to return getSeries(sma50); and I am getting a flat line intraday plot today, with a value different from the sma based on the close yesterday. So I assume that the intraday close of each 15 minute bar is being 'seen' and used to recalculate and update todays flat line plot. So is there any purpose/benefit (in terms of CPU loading) of the if statement, if the series is being updated and the sma recalculated throughout the day?
                              Yes there is. Without it, you force the EFS2 engine to first check and see if a series object with the same parameters has already been initialized. If it sees that it has, then it will not create another instance of the series but refer to the one that already exists. This adds some processing requirements when you make the EFS2 engine perform this check. Using the if() statement eliminates that for you.

                              Option 2 - return sma50.getValue(0);
                              Instead of a flat line plot, I get a curve plot, otherwise I think the sma is still being recalculated based on 15 minute closes? So I'm guessing this option is no less processor intensive than option 1? Or maybe this is just a tiny bit less CPU intensive, because unlike option 1, this does not go back and replot the whole line for the day based on the latest value?
                              Yep, a little less because there is no back-adjusting being performed for the synchronized plotting.

                              Option 3 - return sma50.getValue(-1);
                              In this case I get a flat line plot today, based on yesterdays close. Here I can understand the purpose/benefit of the if statement (assuming the efs is still not seeing and processing the 15 minute closes - is it?). If it is not, then I could see how this would be less CPU intensive.
                              --------------------------------------------------------
                              I beleive I know graphically now (as described above) the difference between each return command. I would like to know which is least and most processor intensive. And in options 1 and 2 it is still a mystery to me what the purpose of the if statement is (which I beleive loads the entire series when the earliest bar of the chart is first loaded) if the series is being continuously updated throughout the day anyway?
                              This was answered above. Let me know if you are still not clear on this.

                              I hope I don't seem obsessed with this, but I think it is a core concept that I need to understand. So I appreciate your patience.

                              Regards
                              shaeffer
                              Not a problem at all. I'm happy to see you diving in EFS2.

                              P.S. If there is a draft of the next efs tutorial (#5) on Series available, I would be happy to review it and return comments from the end-user perspective.
                              I'd be more than appreciative to here your feedback. I don't have a draft ready for review. I'll let you know when I've completed and published the tutorial. If you provide some feedback that warrants some modification we can always update and republish, no problem.
                              Jason K.
                              Project Manager
                              eSignal - an Interactive Data company

                              EFS KnowledgeBase
                              JavaScript for EFS Video Series
                              EFS Beginner Tutorial Series
                              EFS Glossary
                              Custom EFS Development Policy

                              New User Orientation

                              Comment

                              Working...
                              X