 Tweet
Tweet
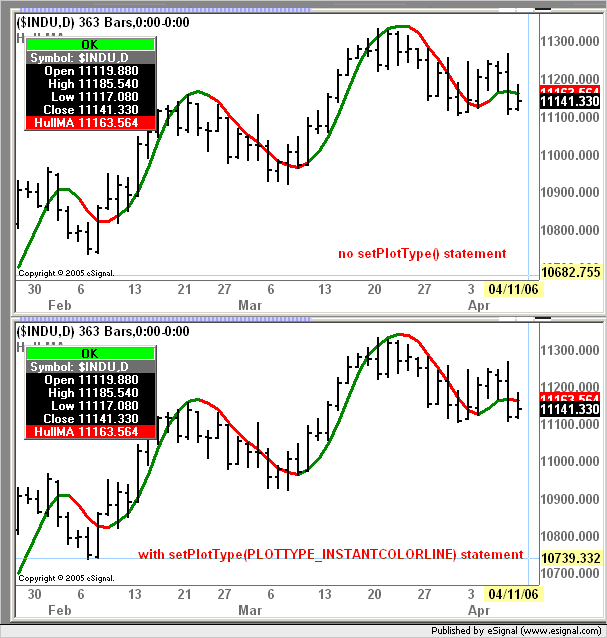
Here is an example of Chris Kryza's recent excellent Hull MA display, available from your efs File Share which can
optionally change color for up and down moves.
I have been using this excellent study for a few weeks now, However, I have become increasingly concerned the
Hull MA line changes color usually one bar too late and decided to investigate this.
Chris' code seems correct and the logic is certainly in the code to accommodate a change in line color, live,
while the current price bar is forming. Having watched this closely over many price bars when, IMO, the
line should have changed color, it never did. It did not change color even when the Hull MA current value in the
right hand price scale changed color during the formation of the current price bar.
So I then added some code of my own to display a text diamond just offset underneath the Hull MA. I used the same logic
as Chris for changing the color of the diamond while the bar was forming.
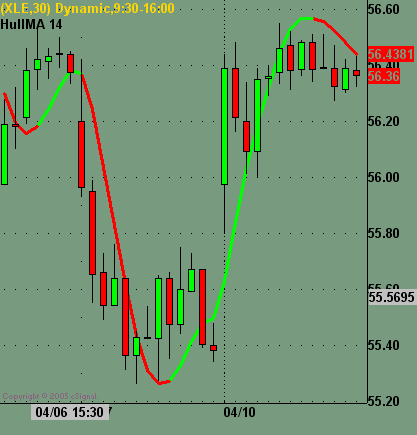
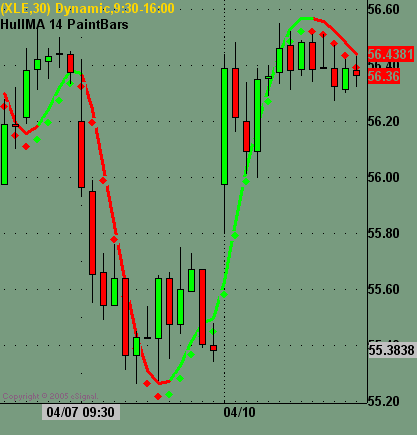
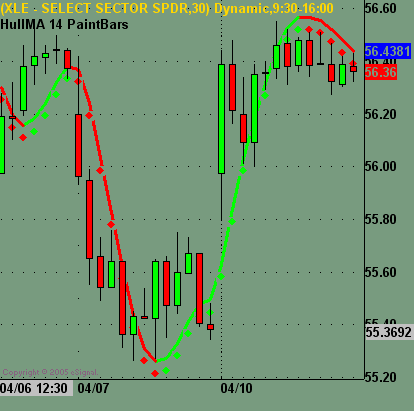
In testing, the text diamond does indeed change color while the current bar is forming - under the appropriate
circumstances - but the Hull MA line does not change color. See in the chart below how at both recent lows the
Hull MA goes up but remains red while my text diamond has corrently changed to green, and at the recent highs
the Hull MA is still green while my text diamond has correctly changed to red. At these 4 "trend change points" my text
diamond had originally been displayed in the opposite color at the beginning of the time interval - similar in color
to the eSignal plotted line - and then changed color at some point during the bar's time interval while the eSignal
plotted line did not change color. It seems the eSignal plotted line stays the color it is originally displayed no matter
what occurs during the rest of the bar time interval.
So my question is simply why does the eSignal plotted line not change color live as it should while the bar is being
formed, yet I can easily display a text symbol that changes color correctly using the same logic?
How is it possible to make the eSignal plotted line change color correctly like my text diamond please?
Regards,
Rob
optionally change color for up and down moves.
I have been using this excellent study for a few weeks now, However, I have become increasingly concerned the
Hull MA line changes color usually one bar too late and decided to investigate this.
Chris' code seems correct and the logic is certainly in the code to accommodate a change in line color, live,
while the current price bar is forming. Having watched this closely over many price bars when, IMO, the
line should have changed color, it never did. It did not change color even when the Hull MA current value in the
right hand price scale changed color during the formation of the current price bar.
PHP Code:
nPlot = nStudy2.getValue(0);


if ( nPlot>nPlot_1 ) {

     setBarFgColor( UpColor, 0 );

     setDefaultBarFgColor( UpColor, 0 );

}


if ( nPlot<=nPlot_1 ) {

     setBarFgColor( DnColor, 0 );

     setDefaultBarFgColor( DnColor, 0 );

}
as Chris for changing the color of the diamond while the bar was forming.
PHP Code:
nPlot = nStudy2.getValue(0);


if ( nPlot>nPlot_1 ) {

     setBarFgColor( UpColor, 0 );

     setDefaultBarFgColor( UpColor, 0 );

     vPaintBarColor = PaintBarColorUp;

}


if ( nPlot<=nPlot_1 ) {

     setBarFgColor( DnColor, 0 );

     setDefaultBarFgColor( DnColor, 0 );

     vPaintBarColor = PaintBarColorDn;

}


if (PaintBarsYesNo == "Yes") {

     removeText("AUp"+vPaintBarCount);

     drawTextRelative(0,nPlot-vPaintBarDistance,"u",vPaintBarColor,null,

     Text.VCENTER|Text.CENTER|Text.BOLD|Text.ONTOP,"Wingdings",PaintBarSize,"AUp"+vPaintBarCount);

}
circumstances - but the Hull MA line does not change color. See in the chart below how at both recent lows the
Hull MA goes up but remains red while my text diamond has corrently changed to green, and at the recent highs
the Hull MA is still green while my text diamond has correctly changed to red. At these 4 "trend change points" my text
diamond had originally been displayed in the opposite color at the beginning of the time interval - similar in color
to the eSignal plotted line - and then changed color at some point during the bar's time interval while the eSignal
plotted line did not change color. It seems the eSignal plotted line stays the color it is originally displayed no matter
what occurs during the rest of the bar time interval.
So my question is simply why does the eSignal plotted line not change color live as it should while the bar is being
formed, yet I can easily display a text symbol that changes color correctly using the same logic?
How is it possible to make the eSignal plotted line change color correctly like my text diamond please?
Regards,
Rob
Comment