 Tweet
Tweet
Is there a study for RSI where you can select what symbol you want tracked? Say, for instance, I want a $TRIN RSI but I don’t necessarily want an extra chart, just a study added to the e-mini; I just need to know where and when $TRIN (or whatever I'm tracking) is leaving/entering overbought/oversold. And maybe an option to adjust the overbought/oversold lines?
-
-
JT47319,
The attached should suit your needs. The default symbol is $INDU, so for $TRIN you will need to go to Edit Studies, and enter in the symbol into the nSymbol field.Regards,
Jay F.
Product Manager
_____________________________________
Have a suggestion to improve our products?
Click Support --> Request a Feature in eSignal 11 -
Sweet thank you, I'll give it a test run.Comment
-
I've been using it and its worked pretty well.
I hate to impose on you guys yet again, but do you think that you could do the same thing with MACD (and the color histogram that is green going up and red when going down)?
Thanks!Last edited by JT47319; 05-05-2003, 09:04 PM.Comment
-
Here is a MACD version.Regards,
Jay F.
Product Manager
_____________________________________
Have a suggestion to improve our products?
Click Support --> Request a Feature in eSignal 11Comment
-
Thanks! Is there a way to make the color histogram auto update? Because I have to make it reload occasionally so it gets the right color.Comment
-
Hey, sorry to keep on pestering you guys, but I tried to insert the var nSymbol and line of code that I saw in the selectable RSI and MACD studies. Then I tried to put it into the color histogram MACD study, but it doesn't actually change it (still slaved to the chart).
function preMain() {
setStudyTitle("$INDU Color MACD Histogram ");
setCursorLabelName("MACD Hist", 0);
setCursorLabelName("MACD", 1);
setCursorLabelName("MACD Sig", 2);
setDefaultBarFgColor(Color.magenta, 0);
setDefaultBarFgColor(Color.blue, 1);
setDefaultBarFgColor(Color.red, 2);
setDefaultBarThickness(4, 0);
setDefaultBarThickness(2, 1);
setDefaultBarThickness(2, 2);
setPlotType(PLOTTYPE_HISTOGRAM, 0);
}
var study = null;
var vColor = null;
var vColorUp = null;
var vColorDn = null;
var vHist = null;
var vHist1 = null;
function main(nFast, nSlow, nSmoothing, PriceSource, nType, nColorUp, nColorDn, nSymbol) {
if (study == null) {
if (nFast == null)
nFast = 12;
if (nSlow == null)
nSlow = 26;
if (nSmoothing == null)
nSmoothing = 9;
if (PriceSource == null)
PriceSource = "Close";
if (nType == null)
nType = false;
if(nSymbol == null)
nSymbol = "$INDU";
/*** Valid Colors ***
aqua, black, blue, brown, cyan, darkgreen,
darkgrey, fushcia, green, grey, khaki,
lightgrey, lightyellow, lime, magenta,
maroon, navy, olive, paleyellow, purple,
red, teal, white, yellow
************************/
if (nColorUp == null) {
vColorUp = Color.lime;
} else {
vColorUp = eval("Color."+nColorUp);
}
if (nColorDn == null) {
vColorDn = Color.red;
} else {
vColorDn = eval("Color."+nColorDn);
}
study = new MACDStudy(nFast, nSlow, nSmoothing, PriceSource, nType);
}
if (vHist != null) {
vHist1 = vHist;
}
vHist = study.getValue(MACDStudy.HIST);
if (vHist == null)
return;
var vMACD = study.getValue(MACDStudy.MACD);
if (vMACD == null)
return;
var vSig = study.getValue(MACDStudy.SIGNAL);
if (vSig == null)
return;
if (vHist1 != null && vHist >= vHist1) {
vColor = vColorUp;
} else if (vHist1 != null && vHist < vHist1) {
vColor = vColorDn;
}
if(vColor != null) {
setBarFgColor(vColor, 0);
}
return new Array(vHist, vMACD, vSig);
}Comment
-
Would there be a neat, modular piece of code that I could put in just about any study that would allow me to use another symbol while its attached to another chart?Comment
-
At this point, the only way to get study data from a different symbol is to use getValue function or one of its "sub-sets" (i.e. open(), close(), etc.), and then calculate the study through the EFS.Originally posted by JT47319
Hey, sorry to keep on pestering you guys, but I tried to insert the var nSymbol and line of code that I saw in the selectable RSI and MACD studies. Then I tried to put it into the color histogram MACD study, but it doesn't actually change it (still slaved to the chart).
Attached is a merging of the MACD Color Histogram, and the MACD different symbol formula. I hope you find it useful.
Regarding the suggestion with having a quick way to request study data from a different symbol, I have seen a few requests for this in the past, and will follow up with our Product Development Team to make sure this gets on the suggestion list (if it's not already.)Regards,
Jay F.
Product Manager
_____________________________________
Have a suggestion to improve our products?
Click Support --> Request a Feature in eSignal 11Comment
-
Thanks J!
There seems to be a difference between the MACD Color Histogram and the MACD Color Histogram with selectable symbol. The latter seems, I dunno, offsett when compared to the earlier MACD Color Histogram or even basic MACD. Call up both and set it $INDU and you'll see what I mean. Again, thanks!!!Comment
-
There appears to be an issue in the EFS that this was built off of (/Formulas/Library/macd.efs). In comparing that EFS with the built in version, there is a distinct difference.
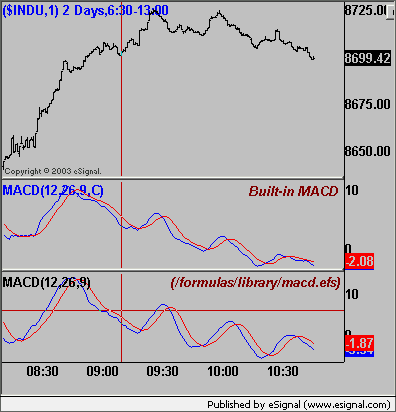
I'll research this further with our QA Team and see if something can be found on it.Regards,
Jay F.
Product Manager
_____________________________________
Have a suggestion to improve our products?
Click Support --> Request a Feature in eSignal 11Comment
-
Hi,
This has been talked about before. The efs version uses a simple MA to calculate the Oscillator portion of the MACD, and the builtin uses an EMA.
If you bring up the built-in and select simple MA for the osc. you should see the same results for both.
GarthGarthComment
-
Indeed. Thank you Garth!Regards,
Jay F.
Product Manager
_____________________________________
Have a suggestion to improve our products?
Click Support --> Request a Feature in eSignal 11Comment
-
So is there a way to make the Color MACD Histogram w/ symbol use EMA instead of SMA? Thx!Comment
-
JT
You may want to look at JasonK's last message in this thread for an example on how to modify the MA to EMA.
AlexComment
Comment