 Tweet
Tweet
Hi. I am trying to look at the net change of the es u6 vs the net change of the nq u6. Ideas?
-
-
gh345
One way you can calculate the Net Change in efs is to use a 1 period Momentum of the daily Close. To do this you need to use the sym() function which allows you to define the symbol and interval on which a study will be based.
Here is a basic example of how you would do this
Note that you can change the symbols through Edit Studies.PHP Code:function preMain(){
setStudyTitle("Net Change");
setCursorLabelName("Sym1",0);
setCursorLabelName("Sym2",1)
setDefaultBarFgColor(Color.blue,0);
setDefaultBarFgColor(Color.red,1);
}
function main(Symbol1,Symbol2){
if(Symbol1==null) Symbol1 = "ES U6,D";//if no symbol is set in Edit Studies use the daily value of ES U6
else Symbol1 = Symbol1+",D";//else use the daily value of the input symbol
if(Symbol2==null) Symbol2 = "NQ U6,D";//same as above for the second symbol
else Symbol2 = Symbol2+",D";//same as above for the second symbol
var xSym1 = mom(1, sym(Symbol1));//Net Change of the first symbol
var xSym2 = mom(1, sym(Symbol2));//Net Change of the second symbol
return new Array (xSym1, xSym2);//return each Net Change to the chart
}
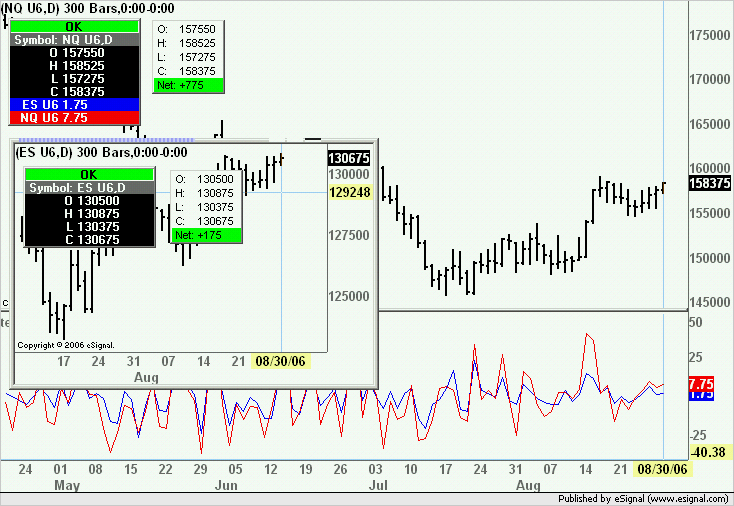
The result is shown in the following chart. As you can see the Net Change of NQ U6 and
ES U6 (shown in their respective Snapshot Windows) are the same as those returned by the script.
The efs can be run on any interval chart and it will return the daily Net Change.
Alex
Comment