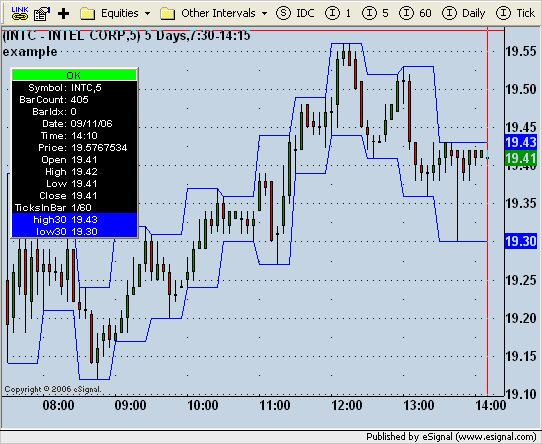
I have managed to confuse myself, and my be making this more difficult than it has to be. I have a 5 min chart. I need to compare the sessions first 30 min high/lows with each subsequent 30 min bar high/low. Is there an easy way to do this? I started out using:
vH= myLib_dsgetMaxValueAtRange("07:30", "8:00", 0, high(inv(30))
but in my thinking I would need to setup that line for each of the 14 bars. There must be a bettrer way. Any ideas?
vH= myLib_dsgetMaxValueAtRange("07:30", "8:00", 0, high(inv(30))
but in my thinking I would need to setup that line for each of the 14 bars. There must be a bettrer way. Any ideas?

Comment