Hello,
I have a doubt about an example on the MACD crossover.
It is located at this link:
I don't know if you can help me.
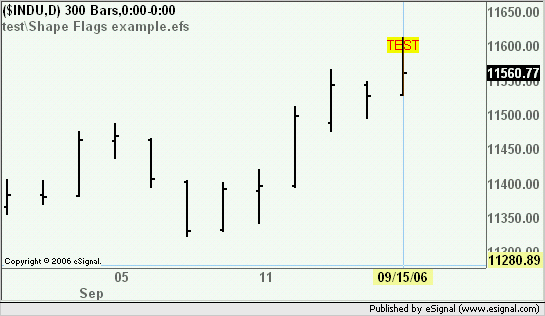
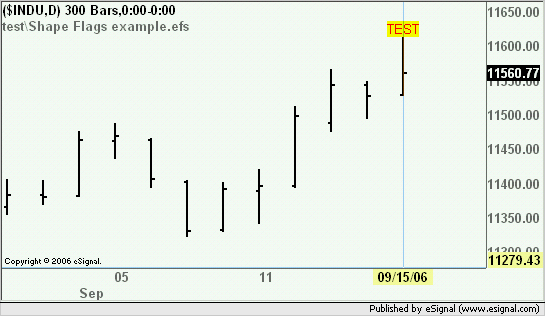
I understand the down arrow on the bar for indicating the crossover, but the item "flags" with value "shape. BOTTOM",
I didn't understand that.
I tried to change it and see if something happened on the chart, but it remained the same.
So, what does it mean practically?
Thanks


Comment