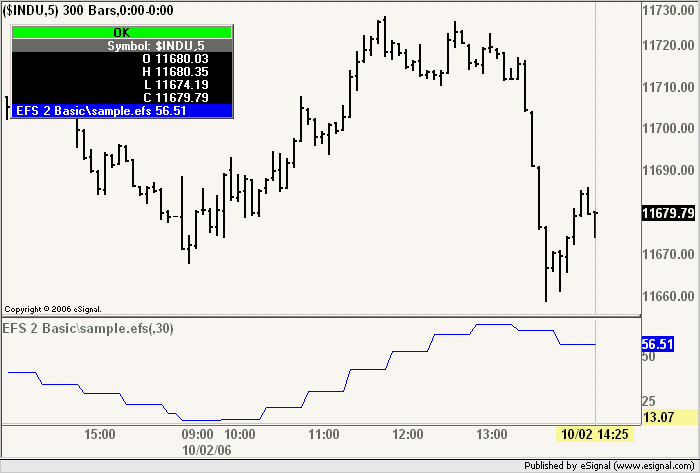
I am trying to display and utilize for a strategy a moving average of a custom study using a higher time interval. Specifically, I am trying to display a 30min custom stochastic on a 15 min chart. I want this 30min indicator to match the value on the 30min chart.
here is the code i have so far:
When this runs on the 15 min chart, the ema is updated every 15 min rather than every 30 min which I believe causes the discrepancy. I tried to use the sym(xStochD +","+Interval), but that doesnt seem to work.
here is the code i have so far:
PHP Code:
var xStochD = null;

var xSlowStochD = null;

var bInit = false;


var KLength = 14;

var KSmoothing = 1;

var DSmoothing = 3;


function main(Symbol, Interval) {


    Interval = 30;


    if(bInit == false){

        if(Symbol == null) Symbol = getSymbol();

        if(Interval == null) Interval = getInterval();

        xStochD = efsExternal("customStochD.efs", KLength,KSmoothing,DSmoothing,Symbol,Interval);

        bInit = true;

    }


    var smoothingFactor = 2 * DSmoothing - 1;

    if (xSlowStochD == null) xSlowStochD = ema(smoothingFactor,xStochD);


    return xSlowStochD.getValue(0);

}

Comment