 Tweet
Tweet
Some people in the SiliconInvestor forums were wanting more grid lines on their chart - specifically for 60, 120 minute charts.
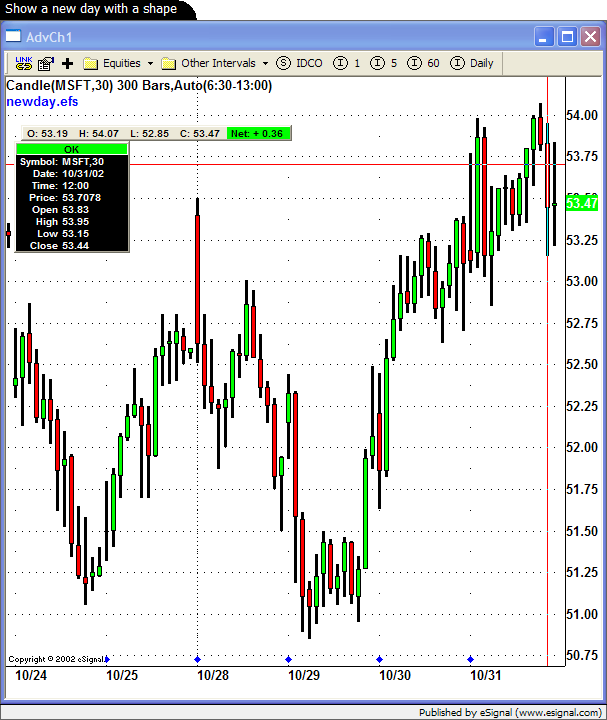
It occurred to me that there is a way to solve this problem using EFS. With EFS, a new day can be detected and when that happens, EFS can draw a shape at the bottom of the chart to denote a new day.
- Matt Gundersen
It occurred to me that there is a way to solve this problem using EFS. With EFS, a new day can be detected and when that happens, EFS can draw a shape at the bottom of the chart to denote a new day.
Code:
function preMain() {
	setPriceStudy(true);
	setStudyTitle("");
	setShowCursorLabel(false);
}

var vLastTime = null;
function main() {
	var vRawTime = getValue("rawtime");
                if(vRawTime == null) {
		return;
                }

	vRawTime = Math.floor(vRawTime / RawTime.DAY);
	if(vLastTime != null  && vRawTime != vLastTime) {
		// Other shapes
		// Shape.CIRCLE
		// Shape.SQUARE
		// Shape.TRIANGLE
		// Shape.DIAMOND
		// Shape.LEFTARROW
		// Shape.RIGHTARROW
		// Shape.UPARROW
		// Shape.DOWNARROW
		// x, y, shape, url, color, flags, tag name
		drawShapeRelative(0, 0, Shape.DIAMOND, "", Color.blue, Shape.RELATIVETOBOTTOM, "NewDay" + vRawTime);
	}

	vLastTime = vRawTime;

}
- Matt Gundersen
Comment