 Tweet
Tweet
Would it be possible to have an indicator that measures the volume of trades going off at the ask -vs- volume going off at bid?
-
-
Hello czumwalt,
Here's a formula that will give you three histograms of volume at the Bid, inside the Bid/Ask, and at the Ask.
BidAskVolume.efs
Here's another helpful Bid/Ask formula that will show you the current Bid/Ask in the right margin of your price chart. The labels will turn green on up ticks and red on down ticks of the Bid/Ask.
BidAsk2.efsJason K.
Project Manager
eSignal - an Interactive Data company
EFS KnowledgeBase
JavaScript for EFS Video Series
EFS Beginner Tutorial Series
EFS Glossary
Custom EFS Development Policy
New User Orientation -
Hello czumwalt,
gspiker pointed out a couple logic errors in the BidAskVolume.efs formula I posted a little while ago. Please download and try the new formula.
Thanks again gspiker.Jason K.
Project Manager
eSignal - an Interactive Data company
EFS KnowledgeBase
JavaScript for EFS Video Series
EFS Beginner Tutorial Series
EFS Glossary
Custom EFS Development Policy
New User OrientationComment
-
Bid/Ask Volume
Hi Jason,
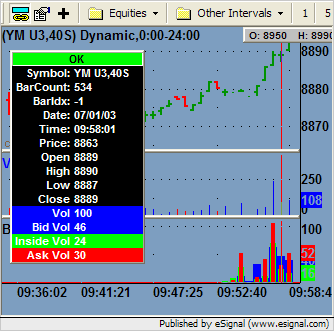
This volume indicator would be a valuable tool for me, but I'm having some difficulties. Its probably the way I'm trying to use it, but when I bring up the lastest version of bidaskvolume.efs in my futures package, it doesnt seem to work. Ive tried it on the emini dow futures (YM U3) plus German futures like ET U3-DT and all I get is either a single blue or red tall bar on the very last tick only. No other bars, just one indicator. I'm using the Tick interval on a normal advanced chart (.ach).
The other efs for the right hand margin bid/ask price works fine. Can you help me?
Thanks
JohnComment
-
John,
The thing to keep in mind with this indicator is that it builds from the point you add it onwards in time. This is due to the way mostRecentBid() and mostRecentAsk() work (no historical data on them.) There also seems to be an issue with the first bar of data being larger then normal.Regards,
Jay F.
Product Manager
_____________________________________
Have a suggestion to improve our products?
Click Support --> Request a Feature in eSignal 11Comment
-
If I remember the code correctly, this 1st bar issue is because you have no previous volume information loaded yet, only the current trading volume. You would need access to T&S info to avoid the 1st bar issue, OR don't start drawing the first bar until AFTER the prev Volume variable was primed.
GarthGarthComment
-
Bid Ask VOlume
Thanks Jay,
I've got it up and running now. One thing, Ive tried it on TICK charts but it says no support but has all 3 volumes displayed but +/- values. Is there any support likely in the near future??
Also tried it on YM U3 on second intervals eg 40s and it seems to come up ok but prints an error message about no tick data support-is this correct and only intervals of 1min or greater are supported?? All of these were done on the advanced chart layout.
Thanks
JohnComment
-
Hi all,
Firstly, its great to have a formula that measures Bid/Ask data. I'm new to this type of price analysis (i primarily use Technical Analysis charting), and have noticed a couple of things i'd really appreciate some assistance on :
1) On a Bearish price bar for example, the Ask trades may be as much as, or more, than the Bid trades. The only way i could figure out that price could have a bearish bias, is due to the balance of BidSize - to AskSize on each trade. Is this so?, and will there be a way to chart Bid and Ask SIZES in future?
2) Can anyone recommend any resources which explain how 'price increases / decreases' due to Bid / Ask influence (as an individual example : after studying T&S it can sometimes take 10 or more contracts to move the ES #F lower, but then only 1 contract, sometimes in a single trade, to move it back higher again? - and vice versa)
I've checked the web and CME / CBOT websites, but couldn't find any solid info on this subject.
Many thanks,
PaulComment
-
Hi Garth,
I've added a priming routine to fix that first bar issue. Try out the new formula.
BidAskVolume.efs
John,
There is an issue with EFS formulas on raw tick charts not working properly. Our developers are aware of it and it's on their list. You shouldn't have problems with a 40s interval though. I tested it today on YM U3 and didn't see any errors. What build are you using?
Paul,
I don't have all the answers to your questions other than the Bid/Ask sizes are not exposed to EFS currently. I will submit that suggestion for you.Jason K.
Project Manager
eSignal - an Interactive Data company
EFS KnowledgeBase
JavaScript for EFS Video Series
EFS Beginner Tutorial Series
EFS Glossary
Custom EFS Development Policy
New User OrientationComment
-
Paul,
Well you are correct the size matters as much as the number of trades. The real question is are the:1) On a Bearish price bar for example, the Ask trades may be as much as, or more, than the Bid trades. The only way i could figure out that price could have a bearish bias, is due to the balance of BidSize - to AskSize on each trade. Is this so?, and will there be a way to chart Bid and Ask SIZES in future?
number of trades * their size (ie:total volume) enough to wipe out all the support (or resistance, depending on direction) at that level.
Again, we go back to needing some way for EFS to tie into depth of field and TOS to really do this right.
However, the bidask tool here does give some interesting pointers. Remeber this is a volume based tool based on bid and ask prices. In theory, is more volume is going in one direction, there should be pressure for the price to move that direction. Of course this will not always be true, esp if you look at shorter time frames...but like all of T/A it is a clue as to what is happening in the market.
It all depends on how many people are sitting on the ask and their sizes vs the number of people buying and their sizes...that is the hear of it. There are who books that have been writen about using depth of field (mostly for stocks, but some of that traslates well for futures as well). If you want I can point you to a few of them(just PM me and I will send you a very short list), but again the ones I know about are oriented towards stocks so I'm not sure how interesting they are for you.2) Can anyone recommend any resources which explain how 'price increases / decreases' due to Bid / Ask influence (as an individual example : after studying T&S it can sometimes take 10 or more contracts to move the ES #F lower, but then only 1 contract, sometimes in a single trade, to move it back higher again? - and vice versa)
Also remember the ES often is lead by the full contract, so you can see some quick jumps at times.GarthComment
-
Jason,
Thanks, I'll try it out.
GarthGarthComment
-
Bid /ask volume
Hi Jason, thanks for reply. I tried the 40s chart for YM U3 and also one of the German futures. It worked ok..maybe it was the same error message coming up from the tick chart that I had loaded before. Anyway, it seems fine now. I also tried this with the new version of bidaskvolume.efs.
By the way im on 7,3 (build 588).
Thanks
JohnComment
-
Jason,
Really like your bid/ask files. I find them very helpful. I made one change: switching the colors on the the volume so that ask volume is in blue and bid volume is in red. Seems to color coordinate better with other indicators.
Comment
-
Originally posted by JayF
John,
The thing to keep in mind with this indicator is that it builds from the point you add it onwards in time. This is due to the way mostRecentBid() and mostRecentAsk() work (no historical data on them.)
Is there no way to display historical data? Can something other than mostRecentBid() and mostRecentAsk() be used so there is no historical data limitation?Comment
-
Lancer,
Sine the who idea of the study is trades at bid vs trades at ask I don't think there is any way else to do this. Sure you can use other metrics to judge pressue, but for this metric you need historical bid/ask.
GarthGarthComment
Comment