 Tweet
Tweet
I have a simple EFS script:
var debugPlotClose = false;
var bInit = false;
var vClose;
var x_Daily_Close;
// These vars hold onto information about potting the last day's closing value on the screen as a line
var closeLineID;
var closeLineDay = 0;
var closeLineNewDayStartCount;
var closeLineStartIndex;
var CloseLineEndIndex;
var closeLineColor = Color.black;
function preMain() {
setPriceStudy(false);
setPlotType(PLOTTYPE_LINE);
}
function main()
{
if (bInit == false)
{
x_Daily_Close = close(sym("GBP A0-FX, D"));
bInit = true;
}
vClose = x_Daily_Close.getValue(-1);
var nState = getBarState();
if (nState == BARSTATE_NEWBAR)
{
plotPreviousDaysClose();
}
}
function postMain() {
}
function plotPreviousDaysClose()
{
if (debugPlotClose)
debugPrintln("Called plotPreviousDaysClose");
var DeltaBarCnt;
var Rawtime = rawtime();
var CurrentBarCount = getCurrentBarCount();
if (closeLineDay)
{
if (closeLineDay != day(0))
{
// The current bar belongs to a new day.
// Draw a new line with a new color and assign a new ID.
closeLineID = Rawtime;
closeLineDay = day(0);
closeLineNewDayStartCount = CurrentBarCount;
DeltaBarCnt = -1;
if (closeLineColor == Color.black)
closeLineColor = Color.blue;
else
closeLineColor = Color.black;
if (debugPlotClose)
{
debugPrintln("We are starting a new day. Drawing line with start: " + DeltaBarCnt + ", end: " + 0 + ", vClose: " + vClose + ", ID = " + closeLineID);
debugPrintln("Start date/time: "+hour(DeltaBarCnt)+":"+(minute(DeltaBarCnt)<10?"0 "+minute(DeltaBarCnt):minute(DeltaBarCnt))+" "+day(DeltaBarCnt)+"/"+month(DeltaBarCnt) + " End date/time: "+hour(0)+":"+(minute(0)<10?"0"+minute(0):minute(0 ))+" "+day(0)+"/"+month(0));
debugPrintln("");
}
drawLineRelative(DeltaBarCnt, vClose, 0, vClose, PS_SOLID, 3, closeLineColor, closeLineID);
}
else
{
// we are still within the current day
// redraw the current line
if (debugPlotClose)
debugPrintln("We are within the current day. Removing LineID: " + closeLineID);
//removeLine(closeLineID);
closeLineID = Rawtime;
DeltaBarCnt = closeLineNewDayStartCount - CurrentBarCount -1;
if (debugPlotClose)
{
debugPrintln("Redrawing line for current day with start: " + DeltaBarCnt + ", end: " + 0 + ", vClose: " + vClose + ", ID = " + closeLineID);
debugPrintln("Start date/time: "+hour(DeltaBarCnt)+":"+(minute(DeltaBarCnt)<10?"0 "+minute(DeltaBarCnt):minute(DeltaBarCnt))+" "+day(DeltaBarCnt)+"/"+month(DeltaBarCnt) + " End date/time: "+hour(0)+":"+(minute(0)<10?"0"+minute(0):minute(0 ))+" "+day(0)+"/"+month(0));
debugPrintln("");
}
drawLineRelative(DeltaBarCnt, vClose, 0, vClose, PS_SOLID, 3, closeLineColor, closeLineID);
}
}
else
{
// This is the first time we are drawing the line.
closeLineID = Rawtime;
closeLineDay = day(1-CurrentBarCount);
closeLineStartIndex = 1-CurrentBarCount;
closeLineNewDayStartCount = CurrentBarCount;
if (debugPlotClose)
{
debugPrintln("Calling plotPreviousDaysClose for 1st time. Plot 1st small line.");
debugPrintln("Start date/time: "+hour(closeLineStartIndex)+":"+(minute(closeLineS tartIndex)<10?"0"+minute(closeLineStartIndex):minu te(closeLineStartIndex))+" "+day(closeLineStartIndex)+"/"+month(closeLineStartIndex));
debugPrintln("closeLineID = " + closeLineID + ", closeLineDay = " + closeLineDay + ", Start index = " + closeLineStartIndex);
debugPrintln("");
}
drawLineRelative(closeLineStartIndex, vClose, 0, vClose, PS_SOLID, 3, closeLineColor, closeLineID);
}
}
================================
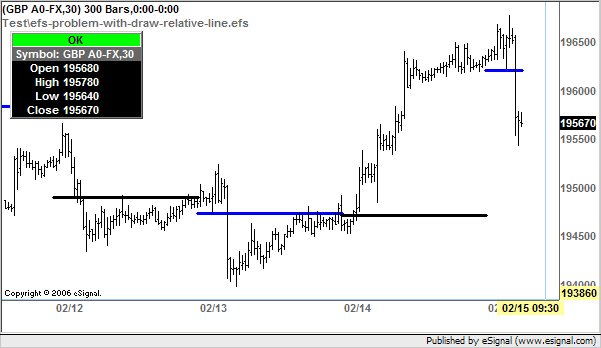
When I run this, it plots only the previous day's closing value as a single line for the most recent day. (I have this loaded in an intraday chart).
But it should plot the previous day's close for each new day from 00:00 to 00:00 (with a little overlap).
I have attached the EFS script. It is hard-coded to be loaded into a GBP A0-FX chart. (View with time template set to 24 hours)
Any clues would be appreciated.
(I tried it with removeLine in and commented out. No difference).
var debugPlotClose = false;
var bInit = false;
var vClose;
var x_Daily_Close;
// These vars hold onto information about potting the last day's closing value on the screen as a line
var closeLineID;
var closeLineDay = 0;
var closeLineNewDayStartCount;
var closeLineStartIndex;
var CloseLineEndIndex;
var closeLineColor = Color.black;
function preMain() {
setPriceStudy(false);
setPlotType(PLOTTYPE_LINE);
}
function main()
{
if (bInit == false)
{
x_Daily_Close = close(sym("GBP A0-FX, D"));
bInit = true;
}
vClose = x_Daily_Close.getValue(-1);
var nState = getBarState();
if (nState == BARSTATE_NEWBAR)
{
plotPreviousDaysClose();
}
}
function postMain() {
}
function plotPreviousDaysClose()
{
if (debugPlotClose)
debugPrintln("Called plotPreviousDaysClose");
var DeltaBarCnt;
var Rawtime = rawtime();
var CurrentBarCount = getCurrentBarCount();
if (closeLineDay)
{
if (closeLineDay != day(0))
{
// The current bar belongs to a new day.
// Draw a new line with a new color and assign a new ID.
closeLineID = Rawtime;
closeLineDay = day(0);
closeLineNewDayStartCount = CurrentBarCount;
DeltaBarCnt = -1;
if (closeLineColor == Color.black)
closeLineColor = Color.blue;
else
closeLineColor = Color.black;
if (debugPlotClose)
{
debugPrintln("We are starting a new day. Drawing line with start: " + DeltaBarCnt + ", end: " + 0 + ", vClose: " + vClose + ", ID = " + closeLineID);
debugPrintln("Start date/time: "+hour(DeltaBarCnt)+":"+(minute(DeltaBarCnt)<10?"0 "+minute(DeltaBarCnt):minute(DeltaBarCnt))+" "+day(DeltaBarCnt)+"/"+month(DeltaBarCnt) + " End date/time: "+hour(0)+":"+(minute(0)<10?"0"+minute(0):minute(0 ))+" "+day(0)+"/"+month(0));
debugPrintln("");
}
drawLineRelative(DeltaBarCnt, vClose, 0, vClose, PS_SOLID, 3, closeLineColor, closeLineID);
}
else
{
// we are still within the current day
// redraw the current line
if (debugPlotClose)
debugPrintln("We are within the current day. Removing LineID: " + closeLineID);
//removeLine(closeLineID);
closeLineID = Rawtime;
DeltaBarCnt = closeLineNewDayStartCount - CurrentBarCount -1;
if (debugPlotClose)
{
debugPrintln("Redrawing line for current day with start: " + DeltaBarCnt + ", end: " + 0 + ", vClose: " + vClose + ", ID = " + closeLineID);
debugPrintln("Start date/time: "+hour(DeltaBarCnt)+":"+(minute(DeltaBarCnt)<10?"0 "+minute(DeltaBarCnt):minute(DeltaBarCnt))+" "+day(DeltaBarCnt)+"/"+month(DeltaBarCnt) + " End date/time: "+hour(0)+":"+(minute(0)<10?"0"+minute(0):minute(0 ))+" "+day(0)+"/"+month(0));
debugPrintln("");
}
drawLineRelative(DeltaBarCnt, vClose, 0, vClose, PS_SOLID, 3, closeLineColor, closeLineID);
}
}
else
{
// This is the first time we are drawing the line.
closeLineID = Rawtime;
closeLineDay = day(1-CurrentBarCount);
closeLineStartIndex = 1-CurrentBarCount;
closeLineNewDayStartCount = CurrentBarCount;
if (debugPlotClose)
{
debugPrintln("Calling plotPreviousDaysClose for 1st time. Plot 1st small line.");
debugPrintln("Start date/time: "+hour(closeLineStartIndex)+":"+(minute(closeLineS tartIndex)<10?"0"+minute(closeLineStartIndex):minu te(closeLineStartIndex))+" "+day(closeLineStartIndex)+"/"+month(closeLineStartIndex));
debugPrintln("closeLineID = " + closeLineID + ", closeLineDay = " + closeLineDay + ", Start index = " + closeLineStartIndex);
debugPrintln("");
}
drawLineRelative(closeLineStartIndex, vClose, 0, vClose, PS_SOLID, 3, closeLineColor, closeLineID);
}
}
================================
When I run this, it plots only the previous day's closing value as a single line for the most recent day. (I have this loaded in an intraday chart).
But it should plot the previous day's close for each new day from 00:00 to 00:00 (with a little overlap).
I have attached the EFS script. It is hard-coded to be loaded into a GBP A0-FX chart. (View with time template set to 24 hours)
Any clues would be appreciated.
(I tried it with removeLine in and commented out. No difference).
Comment