Announcement

Collapse
No announcement yet.

Some Built-In Studies Lag When Using an efsInternal Series as Their Source

Collapse
X
 
  • Filter
  • Time
  • Show
Clear All
new posts

  • Some Built-In Studies Lag When Using an efsInternal Series as Their Source

    All,

    I'm probably missing yet another fundamental EFS concept/best practice, but I noticed that sometimes when I pass a series created via efsInternal as the source to some of the built-in studies, I get a 1 bar lag effect.

    I created the following script to help flush out the problem. When you run it I would expect each ema() output series to produce the exact same result, which means there should be 3 lines exactly on top of each other. Unfortunately, in the ema() case the outputSeries2 lags by one bar. I tried substituting ema with other studies. sma, and cci both lag. rsi and stochK don't lag. roc and moneyFlow seem to work with inputSeries0 but may or may not work with the other input series depending on the formula you pass them. I'm sure the remaining studies are hit or miss as well.

    So why do the ema and some of the other studies lag in outputSeries2 whereas some don't? And what should I do to stop any of them from lagging?

    And as an aside, why in the ema() case is outputSeries1 a constant value when the formula is set to "ohlc4()"? I "fixed" this problem by whimsically setting the formula to "getSeries(ohlc4(), 0)". Also, why can either formula be used if you change ema to rsi?

    Thanks,

    Jeff

    Code:
    function preMain()
    {
        setDefaultBarFgColor(Color.blue, 0);
        setDefaultBarFgColor(Color.green, 1);
        setDefaultBarFgColor(Color.red, 2);
    }
    
    var formula = "getSeries(ohlc4(), 0)";       // Why does this way work?
    // var formula = "ohlc4()";                  // And sometimes this doesn't work?
    // var formula = "stochK(9, 1, 1, ohlc4())";
    
    var inputSeries0 = null;
    var inputSeries1 = null;
    var inputSeries2 = null;
    
    var outputSeries0 = null;
    var outputSeries1 = null;
    var outputSeries2 = null;
    
    var fullyInitialized = false;
    
    function main()
    {
        if (!fullyInitialized)
        {
            if (inputSeries0 == null)
                inputSeries0 = eval(formula);
            if (inputSeries1 == null)
                inputSeries1 = efsInternal("regurgitate", inputSeries0);
            if (inputSeries2 == null)
                inputSeries2 = efsInternal("hardCoded");
    
            if (outputSeries0 == null)
                outputSeries0 = ema(5, inputSeries0);
            if (outputSeries1 == null)
                outputSeries1 = ema(5, inputSeries1);
            if (outputSeries2 == null)
                outputSeries2 = ema(5, inputSeries2);
    
            fullyInitialized = true;
        }
    
        return [outputSeries0.getValue(0),
                outputSeries1.getValue(0),
                outputSeries2.getValue(0)];
    }
    
    function regurgitate(aSeries)
    {
        return aSeries;
    }
    
    function hardCoded()
    {
        return eval(formula);
    }
  • #2
    Hello Jeff,

    Regarding the 1 bar lag, I'm not seeing this problem with the code that you have posted as is. Please post some chart images as to what you are seeing on your end. That may provide some additional clues. Try comparing it to the Basic Studies Moving Avg study set to 5 periods, OHLC4 and exponential.

    As for your coding questions, the reason var formula = "getSeries(ohlc4(), 0)"; works is because the getSeries() function is creating a series based on the ohlc() results. Therefore, all three of your series initialization examples work.

    The reason var formula = "ohlc4()"; does not work is because the ohlc4() function does not return a series object when used as a stand alone function. This function is a macro (for lack of a better description) that was created to be used as a source for a built-in series function. When used as a stand alone function it returns a single value. Therefore outputSeries1 becomes a flat line reflecting that value. You can make a small modification to the regurgitate function to make it work, however. Try the following.

    PHP Code:
    function regurgitate(aSeries)
    {
        
    //return aSeries.getValue(0);
        //or
        
    return getSeries(aSeries);

    Jason K.
    Project Manager
    eSignal - an Interactive Data company

    EFS KnowledgeBase
    JavaScript for EFS Video Series
    EFS Beginner Tutorial Series
    EFS Glossary
    Custom EFS Development Policy

    New User Orientation

    Comment


    • #3
      Hi Jason,

      Thanks for the formula getSeries() answer.

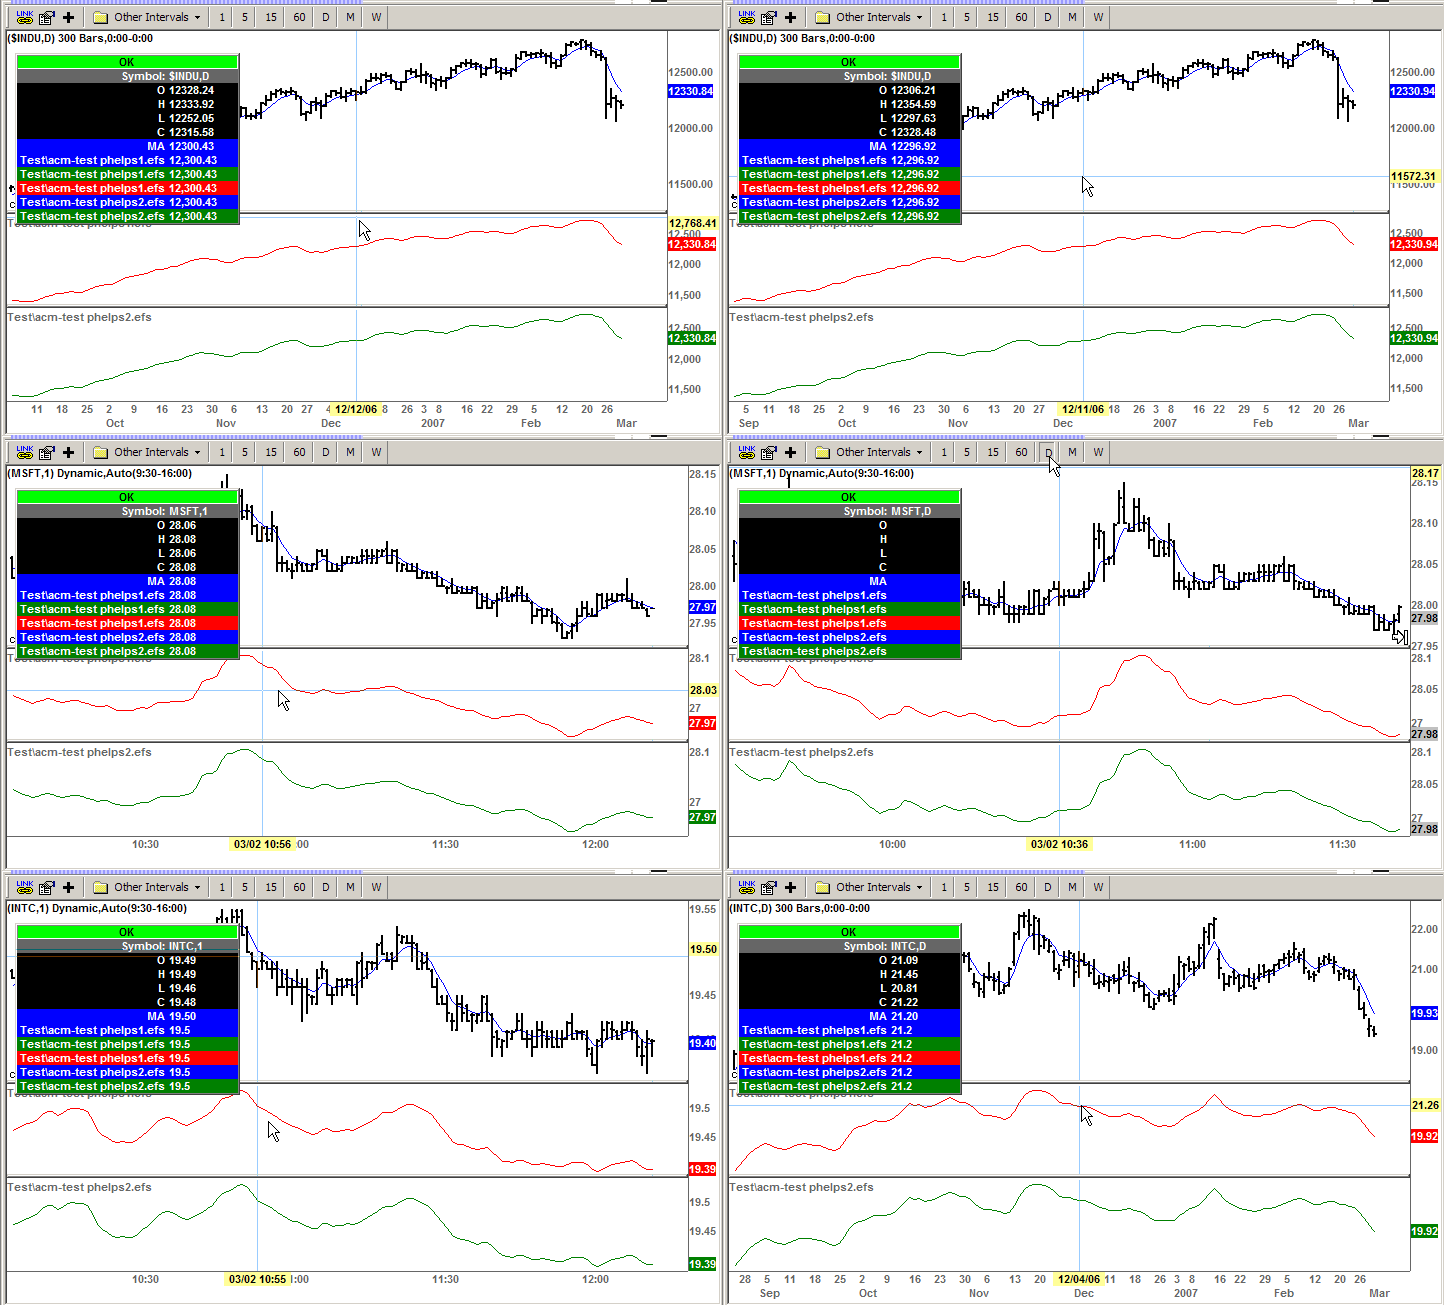
      As for the lag problem, I attached an image of a chart that shows what I am seeing. The blue line in the top panel is the Basic Studies ema. It aligns with panel 2's blue line (as expected). But why is the red line (outputSeries2) delayed by 1 bar? And why is the green line under the red line? I.e. why is outputSeries1 delayed too? I verified it is lurking there by adding a 0.01 to outputSeries1 -- see panel 3.

      To create panel 4, I simply changed all "ema"s to "rsi"s, and then loaded the program. Obviously, you can only see one line since all the series "line up". In panel 5 I verified all the lines are there by adding some vertical offsets to outputSeries1 and outputSeries2. Regardless, all the peaks and valleys line up with the Basic Studies RSI at the bottom.

      So, why does the ema version seem to have issues and why does the rsi version seem ok?

      Thanks.

      Jeff
      Attached Files

      Comment


      • #4
        I hope I'm not about to confuse things, but here is a simpler program that demonstrates the problem:

        Code:
        function preMain()
        {
            setDefaultBarFgColor(Color.blue, 0);
            setDefaultBarFgColor(Color.green, 1);
        }
        
        var series0 = null;
        var series1 = null;
        
        function main()
        {
            if (series0 == null)
                series0 = ema(5, ohlc4());
            if (series1 == null)
                series1 = ema(5, efsInternal("regurgitate", ohlc4()));
        
            return [series0.getValue(0), series1.getValue(0)];
        }
        
        function regurgitate(aSeries)
        {
            return aSeries.getValue(0);
        }

        Comment


        • #5
          For grins, I rebooted my machine, got back into eSignal, loaded up a default MSFT chart, applied the first code I posted, and tada! It worked!

          But not so fast -- I realized I was looking at a daily MSFT chart. When I changed to a 1 minute MSFT chart the lag showed up. I suppose I should have mention before that I was using MSFT,1....

          Comment


          • #6
            Jeff
            Make sure that the "Make all formulas compute on close..." option in Tools-> EFS-> Settings is unchecked as that setting is not compatible with the efsInternal() and efsExternal() functions.
            With that option disabled your scripts should be working fine (see enclosed animation)
            Alex

            Comment


            • #7
              That fixed it! Thank you very much. I promise to get over my EFS newbieitis real soon.

              I also see the efsInternal/efsExternal descriptions in the EFS KnowledgeBase clearly state to not use the compute on close option. I'll be more careful in the future.

              Comment


              • #8
                Jeff
                You are most welcome and thank you for the feedback
                Alex

                Comment

                Working...
                X