Announcement

Collapse
No announcement yet.

Minimized charts don't update

Collapse
X
 
  • Filter
  • Time
  • Show
Clear All
new posts

  • Minimized charts don't update

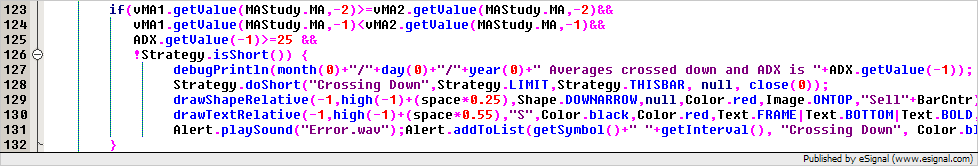
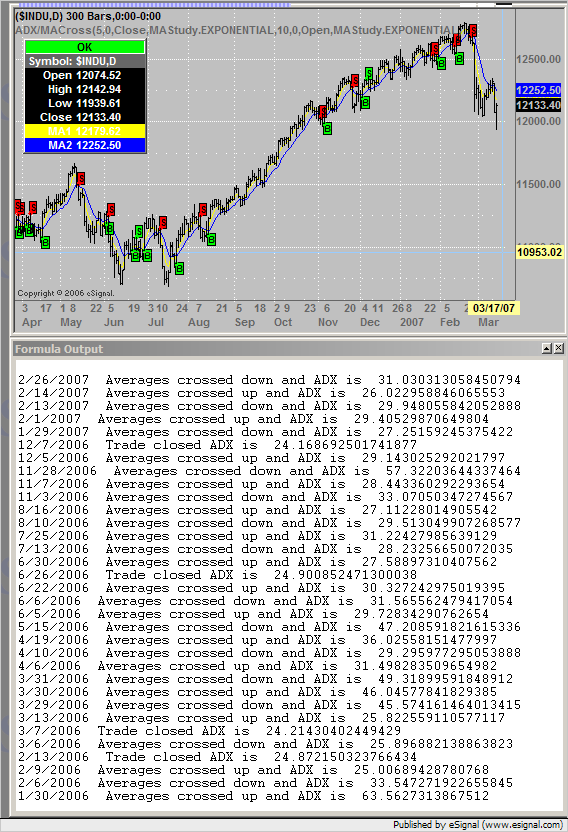
    Please...is there anyone out there that can help with my formula. I have d-loaded a simple MA crossover and tweeked it a bit to suit my needs but I can't get it to update real time. I understand that it should update even when minimized but it will not. I know there are tons of posts on this subject but I an new to e-signal and definately new to programming and if someone could just point me to the appropriate thread I would really appreciate it.

    Much Thanks,
    Tony
    Attached Files

  • #2
    Tony
    The problem is caused by the following conditional statements
    PHP Code:
    if(vMA1.getValue(MAStudy.MA,-1)<=vMA2.getValue(MAStudy.MA,-1)&&
               
    vMA1.getValue(MAStudy.MA,0)>vMA2.getValue(MAStudy.MA,0)&&
               !
    Strategy.isLong()) {

    if(
    vMA1.getValue(MAStudy.MA,-1)>=vMA2.getValue(MAStudy.MA,-1)&&
               
    vMA1.getValue(MAStudy.MA,0)<vMA2.getValue(MAStudy.MA,0)&&
               !
    Strategy.isShort()) { 
    These conditions are looking at the prior and current values of the moving averages however because they are enclosed in a BARSTATE_NEWBAR condition they are evaluated [when running in real time] only on the first tick of a new bar and will not execute any command(s) unless the crossover occurrs on that instant.
    Change the conditions to the following where they will be looking at the values of the averages of two bars ago and of the prior bar (which at this point is a completed bar)
    PHP Code:
    if(vMA1.getValue(MAStudy.MA,-2)<=vMA2.getValue(MAStudy.MA,-2)&&
               
    vMA1.getValue(MAStudy.MA,-1)>vMA2.getValue(MAStudy.MA,-1)&&
               !
    Strategy.isLong()) {

     if(
    vMA1.getValue(MAStudy.MA,-2)>=vMA2.getValue(MAStudy.MA,-2)&&
               
    vMA1.getValue(MAStudy.MA,-1)<vMA2.getValue(MAStudy.MA,-1)&&
               !
    Strategy.isShort()) { 
    and the script should work correctly.
    Alex

    Comment


    • #3
      tonman1,

      The if statement on line 98 is telling your script to only execute what's inside the if statement at a new bar. So no trades will be started/stopped until a new bar/candle is started.

      This means that if you apply this formula to a daily chart, it will only do trades once a day at the open. On a 5 minute chart it will only do trades on 5 minute boundries.

      Even if you comment out lines 98 and 119 to get rid of the if statement, the Strategy statements will only buy/sell at the open price due to the Strategy.MARKET and Strategy.THISBAR parameters. This may give you inaccurate results in backtesting if you don't have the BARSTATE_NEWBAR if statement.

      The moving average lines should update in real time since they are outside the if statement. But they won't generate a trade when they cross until a new bar is drawn.

      To make it work in real time, comment out lines 98 and 119. Change your Strategy.doLong statement to
      PHP Code:
      Strategy.doLong("Crossing Up",Strategy.LIMIT,Strategy.THISBARnullclose(0)); 
      and your Strategy.doShort to
      PHP Code:
      Strategy.doShort("Crossing Down",Strategy.LIMIT,Strategy.THISBARnullclose(0)); 
      This will buy at the current price instead of the open.

      If you are backtesting with this strategy, these changes will give you inaccurate results since close(0) will give you the bar closing price, not the price the MA cross occured at. The changes will trigger a trade if at any time during the bar the MA crosses. It will do a trade even if the MA crosses for a second and then falls back so it's not crossed any more.

      Steve

      Comment


      • #4
        Alex and Steve...

        Thank you so much for your input. The last programming I had was in college and that was Basic and Fortran 77. So I'm really starting from scratch trying to write the program to do what I'm thinking.

        How would I write in a condition in the same MA formula that would only generate a buy/sell if the ADX were at some number....say 25?

        What I mean is...the MA's are crossing but the signal is only given if the ADX is at or above 25...so all conditions must be present for the signal to go off.

        I think my problem is I don't know how to specify just the ADX, not the DI,s and then specify the number 25.

        Once again, any help that you can give is greatly appreciated and helping to keep my frustration level to a minimum.

        Thanks!

        Comment


        • #5
          Tony
          You are most welcome.
          With regards to your question you could do it as shown below (note that this is just an example to illustrate the required logic). For more information on the syntax and parameters of the ADX functions see this article in the EFS KnowledgeBase
          For detailed examples and information on the Strategy Object you may want to review the Back Testing Tutorials that are available in the EFS KnowledgeBase under Help Guides and Tutorials-> Beginner Tutorials
          Alex

          PHP Code:
          //your code to declare your global variables
          var myADX null;//declare a global variable to store the ADX series

          function main(){

              
          //your code to calculate/initialize the averages called for example myAvg1 and myAvg2
              
          if(myADX==nullmyADX adx(14,14);//initialize the ADX series

              
          if(myADX.getValue(0)==null) return; //null check on the value of the ADX to ensure it is a valid number

              
          if(!Strategy.isLong()){//if not already in a trade
                  
          if(myADX.getValue(0)>25){//if the ADX is greater than 25
                      
          if(myAvg1.getValue(0)>myAvg2.getValue(0)){//if myAvg1 is above myAvg2 
                          
          Strategy.doLong(....);//enter a long trade
                      
          }
                  }
              }

              
          //rest of your code 

          Comment


          • #6
            MAx/ADX

            Alexis,

            Once again thank you for your help. That gets me on the right track but I have alot to learn yet. There are some basic questions that I have that I can't seem to find reference to.

            Like in the main function...

            var space = 1;
            if (getInterval() != "D")
            space = high(-1)-low(-1);

            if(getBarState() == BARSTATE_NEWBAR){

            BarCntr +=1;

            Do you know where I can find this reference to "var space" and I don't understand !="D"

            Also, do I need two formulas...one for backtesting and one for real time? It seems in my reading over the weekend that was stated.

            If I'm running the formula on multiple charts...I know how to program in the alert and e-mail alert, but is there a way to have the chart that the alert references pop up too? That would be cool.

            I've attached my formula that I'm butchering up. Thanks again.
            Attached Files

            Comment


            • #7
              Tony

              Do you know where I can find this reference to "var space" and I don't understand !="D"
              The variable space is just a user defined variable which in the case of the script you posted is assigned an intiail value of 1 and if the interval is not Daily is then used to store the calculation of the High-Low (ie the Range) of the prior bar hence the high(-1) and low(-1). This variable is then used [adjusted by a multiplier] in the drawTextRelative(...) and drawShapeRelative(...) commands to position the text and shapes on the chart in specific locations.
              As to the condition if (getInterval() != "D") that checks if the interval of the chart is not daily (ie "D") interval in which case it assigns to the variable space the result of high(-1)-low(-1). If the interval is instead daily the value of space is 1 which is what it is assigned when the variable is declared (see line 96 of your script)

              Also, do I need two formulas...one for backtesting and one for real time? It seems in my reading over the weekend that was stated.
              eSignal does recommend to use two distinct sets of logics one for backtesting which uses the Strategy Object and one for real time which relies on user defined variables to track the status of the trading system
              These can be accomplished either through separate scripts or within the same script through some conditional statement that implements either one or the other logic based on a user defined parameter.

              is there a way to have the chart that the alert references pop up too? That would be cool.
              To do that you use Alert.addToList() method (see the link for the syntax)
              Alex

              Comment


              • #8
                Tony
                Following up on my prior reply. The script you posted is based on relatively old code. At that time there was no pre-defined way to position text, shapes, etc so that was one solution to the issue.
                Since then, with the advent of efs2 new location parameters have been added to the formula language which make it easier to position text or shapes without the need to calculate these locations yourself.
                These new parameters are AboveBar1, AboveBar2 (up to AboveBar4) and corresponding BelowBar1-4
                For the syntax of these location parameters see either the Text.PRESET flag in this article of the EFS KnowledgeBase on drawTextRelative() or the Shape.PRESET flag in this article on drawShapeRelative()
                Alex

                Comment


                • #9
                  ADX/MA cross

                  Alex,

                  Thanks again.

                  I take it that I can take this part out of the formula and replace it with the new code. I will experiment with it and see if I can get it straight.

                  How would I work the logic with this idea...

                  I want to go long MAs crossing up and ADX >=25
                  sell when ADX <25 or
                  reverse trade (short) MAs crossing down ADX still >=25

                  go short MAs crossing down and ADX >=25
                  sell when ADX <25 or
                  reverse trade (go long) MAs crossing up ADX>=25...

                  Once again your input is greatly appreciated!

                  Comment


                  • #10
                    Tony

                    I take it that I can take this part out of the formula and replace it with the new code.
                    That is correct. The new location flags simplify considerably the task of positioning text and shapes.

                    How would I work the logic with this idea...
                    Using the script that you posted earlier here is an example of the logic that you would need to implement.
                    In lines 105-107 where you have the condition that triggers a long entry you just need to add a condition that checks for the value of the ADX at the prior bar to be greater or equal to 25 eg
                    PHP Code:
                    if(vMA1.getValue(MAStudy.MA,-2)<=vMA2.getValue(MAStudy.MA,-2)&&
                    vMA1.getValue(MAStudy.MA,-1)>vMA2.getValue(MAStudy.MA,-1)&&
                    ADX.getValue(-1)>=25 && !Strategy.isLong()) {//added ADX condition here
                        
                    Strategy.doLong(...<your parameters here>...);
                        <
                    rest of your code here>

                    Apply the same logic to the condition that triggers the short trades in lines 114-116
                    Then insert the following code after the closing bracket in line 121 (and before the closing bracket in line 122)
                    PHP Code:
                    if(ADX.getValue(-1)<25){
                        if(
                    Strategy.isLong()){
                            
                    Strategy.doSell(...<your parameters here>...);
                        }
                        if(
                    Strategy.isShort()){
                            
                    Strategy.doCover(...<your parameters here>...);
                        }

                    This will close either a long or short trade if the ADX falls below 25
                    For further examples on the logic required by the Strategy Object I would suggest you review the Back Testing Tutorials that are available in the EFS KnowledgeBase under Help Guides and Tutorials-> Beginner Tutorials
                    Alex

                    Comment


                    • #11
                      MAx/ADX

                      Alex,

                      Still putting it together and learning alot along the way. Just wondering if you could check out my formula. Needless to say,it is not working but I have stopped getting the syntax errors. For me that's progress I guess.

                      I'm trying to get it to send an e-mail when any of the following conditions are met..

                      crossing up and ADX>=25
                      crossing down and ADX>=25
                      ADX<25
                      ..and when the MA's have previously crossed but the ADX moves back above 25 again.

                      The MA's are also not showing up on the chart.

                      Thanks again for the input. I know I'll get it eventually.
                      Attached Files

                      Comment


                      • #12
                        Tony
                        You need to move the code that is currently in lines 134-147 of your script and insert it after the closing bracket in line 130 and before the closing bracket in line 131 as shown in the following image


                        Then to plot the moving average lines you need to modify the return statement and replace this line of code
                        PHP Code:
                        return new Array (vMA1.getValue(MAStudy.MA),vMA2.getValue(MAStudy.MA),adx.getValue(ADX)); 
                        with the following
                        PHP Code:
                        return new Array (vMA1.getValue(MAStudy.MA),vMA2.getValue(MAStudy.MA)); 
                        To send emails you need to add an Alert.email() command for each condition. For the parameters and syntax of this function see the linked article in the EFS KnowledgeBase
                        Alex

                        Comment


                        • #13
                          ADX/MAcross

                          Alex,

                          The formula I'm trying to write is getting closer to doing what I want but I still have some questions that I'm unsure about.

                          I'm still getting a buy/sell signal when the MAs cross even if the ADX is < 25.

                          I don't get a signal to re-enter...say if the MAs crossed several periods prior and the ADX went <25 and the went > 25....I get a signal to cover when the ADX goes < 25....but if the ADX goes > 25 I would like to get a signal to re-enter the position.

                          Should I be writing in some kind of loop?

                          Also, I was reading that the .doshort, dolongs in the formula and it said they should only be used for backtesting. What then should I be using for real time? Little confused on this one. I think it would be best to write them at the same time. How is it usually done?

                          Thanks again..
                          Tony
                          Attached Files

                          Comment


                          • #14
                            Tony
                            As far as I can see the strategy is entering trades only when the value of the ADX [at the prior bar] is equal to or greater than 25.
                            In these cases the best thing to do is to use the debugPrintln() function and record the relevant data when each conditional statement evaluates to true. In the following screenshot you can see an example of how to do this


                            The following screenshot shows your script (modified to include the debug statements) running on a daily chart of the Dow Industrials and the resulting Formula Output. In the Formula Outpiut window you can see that for each trade entry the ADX was equal to or greater than 25 and that when the ADX dropped below 25 the trades were closed.


                            If you are getting different results then please provide a specific example of symbol, interval, time template and parameters used. If possible also include a snapshot of the chart that illustrates where the event is occurring.
                            As to re-entering trades the script should already be doing that when the averages cross. Again if you have a specific example where you are not seeing this please provide the necessary information
                            With regards to using the script in real time you should be creating your own variables to keep track of the status of the system. You can find detailed explanations and examples of this in the Back Testing Tutorials I referenced in my prior replies.
                            Alex

                            Comment


                            • #15
                              tonman1,

                              Your study was actually working fine. It was your drawing that was off by 1 bar.

                              I've changed that to display on the current bar instead of bar -1, and added in code to handle backtesting or realtime mode. You can use this as a starting point if it doesn't do what you want.

                              I also changed your strategy code. You were using Strategy.LIMIT with close(0) as the price. This is the same as using Strategy.CLOSE.

                              To handle the broker functions used in real time mode, I added 2 more function parameters. One is a flag to pick real time or back testing. The other is how many shares you want to trade in real time mode. Since the broker functions don't keep track of if you're in a trade or not, I added a variable, vTradeState, to track that.

                              Steve
                              Attached Files

                              Comment

                              Working...
                              X