 Tweet
Tweet
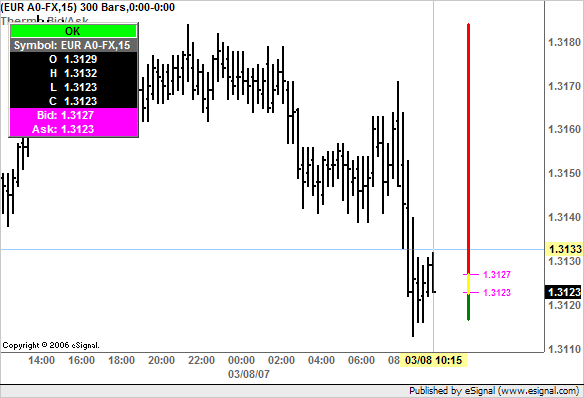
Would anyone be so kind and suggest how I can display the Bid/Ask values and change the Thermometer bar color to show the spread as indicated in the picture?
var fpArray = new Array();
var bInit = false;
var vInterval = null;
var xOpen = null;
var xHigh = null;
var xLow = null;
var xClose = null;
function preMain() {
setPriceStudy(true);
setStudyTitle("Thermo Bid/Ask");
setShowCursorLabel(true);
setPriceStudy(true);
setColorPriceBars(true);
setCursorLabelName("Bid:", 0);
setCursorLabelName("Ask:", 1);
setDefaultBarFgColor( Color.red, 0 );
setDefaultBarFgColor( Color.green, 1 );
//setDefaultPriceBarColor( Color.red, 0 );
//setDefaultPriceBarColor( Color.green, 1 );
setShowTitleParameters(false);
var x=0;
fpArray[x] = new FunctionParameter("Interval", FunctionParameter.STRING);
with(fpArray[x++]){
setDefault();
}
fpArray[x] = new FunctionParameter("Lookback", FunctionParameter.NUMBER);
with(fpArray[x++]){
setLowerLimit(0);
setDefault(0);
}
fpArray[x] = new FunctionParameter("Params", FunctionParameter.BOOLEAN);
with(fpArray[x++]){
setName("Show Parameters");
setDefault(false);
}
}
var b = null;
var b1 = null;
var a = null;
var a1 = null;
var aColor = Color.grey;
var bColor = Color.grey;
function main(Interval,Lookback,Params) {
b1 = b;
a1 = a;
b = getMostRecentBid();
if (b == null) b = b1;
if (b > b1) {
bColor = Color.lime;
} else if (b < b1) {
bColor = Color.magenta;
}
b *= 10000
b = Math.round(b);
b /=10000;
drawShapeRelative(7, b, Shape.CIRCLE, null, bColor, Shape.ONTOP, "bid");
drawLineRelative(6, b, 9, b, PS_SOLID, 1, bColor, "bid line"); setDefaultBarFgColor(bColor, 0);
drawTextRelative(4, b1, "B", bColor, null, Text.BOLD | null | Text.VCENTER | Text.ONTOP, null, 8, "bid text");
a = getMostRecentAsk();
if (a == null) a = a1;
if (a > a1) {
aColor = Color.lime;
} else if (a < a1) {
aColor = Color.magenta;
}
a *= 10000
a = Math.round(a);
a /=10000;
drawShapeRelative(7, a, Shape.CIRCLE, null, aColor, Shape.ONTOP, "ask");
drawLineRelative(6, a, 9, a, PS_SOLID, 1, aColor, "ask line"); setDefaultBarFgColor(aColor, 1);
drawTextRelative(4, a1, "A", aColor, null, Text.BOLD | null | Text.VCENTER | Text.ONTOP, null, 8, "ask text");
if(bInit == false){
if(isIntraday() && Interval == null) Interval = "D";
else if(isDaily() && Interval == null) Interval = "W";
else if(isWeekly() && Interval == null) Interval = "M";
else if(Interval == null) Interval = getInterval();
vInterval = Interval;
xOpen = open(inv(vInterval));
xHigh = high(inv(vInterval));
xLow = low(inv(vInterval));
xClose = close(inv(vInterval));
setShowTitleParameters(eval(Params));
bInit = true;
}
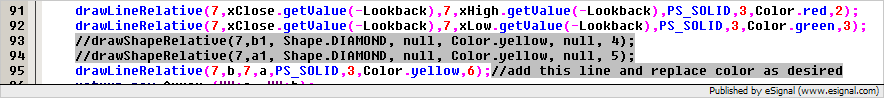
drawLineRelative(7,xClose.getValue(-Lookback),7,xHigh.getValue(-Lookback),PS_SOLID,3,Color.red,2);
drawLineRelative(7,xClose.getValue(-Lookback),7,xLow.getValue(-Lookback),PS_SOLID,3,Color.green,3);
drawShapeRelative(7,b1, Shape.DIAMOND, null, Color.yellow, null, 4);
drawShapeRelative(7,a1, Shape.DIAMOND, null, Color.yellow, null, 5);
return new Array (""+a, ""+b);
}
var fpArray = new Array();
var bInit = false;
var vInterval = null;
var xOpen = null;
var xHigh = null;
var xLow = null;
var xClose = null;
function preMain() {
setPriceStudy(true);
setStudyTitle("Thermo Bid/Ask");
setShowCursorLabel(true);
setPriceStudy(true);
setColorPriceBars(true);
setCursorLabelName("Bid:", 0);
setCursorLabelName("Ask:", 1);
setDefaultBarFgColor( Color.red, 0 );
setDefaultBarFgColor( Color.green, 1 );
//setDefaultPriceBarColor( Color.red, 0 );
//setDefaultPriceBarColor( Color.green, 1 );
setShowTitleParameters(false);
var x=0;
fpArray[x] = new FunctionParameter("Interval", FunctionParameter.STRING);
with(fpArray[x++]){
setDefault();
}
fpArray[x] = new FunctionParameter("Lookback", FunctionParameter.NUMBER);
with(fpArray[x++]){
setLowerLimit(0);
setDefault(0);
}
fpArray[x] = new FunctionParameter("Params", FunctionParameter.BOOLEAN);
with(fpArray[x++]){
setName("Show Parameters");
setDefault(false);
}
}
var b = null;
var b1 = null;
var a = null;
var a1 = null;
var aColor = Color.grey;
var bColor = Color.grey;
function main(Interval,Lookback,Params) {
b1 = b;
a1 = a;
b = getMostRecentBid();
if (b == null) b = b1;
if (b > b1) {
bColor = Color.lime;
} else if (b < b1) {
bColor = Color.magenta;
}
b *= 10000
b = Math.round(b);
b /=10000;
drawShapeRelative(7, b, Shape.CIRCLE, null, bColor, Shape.ONTOP, "bid");
drawLineRelative(6, b, 9, b, PS_SOLID, 1, bColor, "bid line"); setDefaultBarFgColor(bColor, 0);
drawTextRelative(4, b1, "B", bColor, null, Text.BOLD | null | Text.VCENTER | Text.ONTOP, null, 8, "bid text");
a = getMostRecentAsk();
if (a == null) a = a1;
if (a > a1) {
aColor = Color.lime;
} else if (a < a1) {
aColor = Color.magenta;
}
a *= 10000
a = Math.round(a);
a /=10000;
drawShapeRelative(7, a, Shape.CIRCLE, null, aColor, Shape.ONTOP, "ask");
drawLineRelative(6, a, 9, a, PS_SOLID, 1, aColor, "ask line"); setDefaultBarFgColor(aColor, 1);
drawTextRelative(4, a1, "A", aColor, null, Text.BOLD | null | Text.VCENTER | Text.ONTOP, null, 8, "ask text");
if(bInit == false){
if(isIntraday() && Interval == null) Interval = "D";
else if(isDaily() && Interval == null) Interval = "W";
else if(isWeekly() && Interval == null) Interval = "M";
else if(Interval == null) Interval = getInterval();
vInterval = Interval;
xOpen = open(inv(vInterval));
xHigh = high(inv(vInterval));
xLow = low(inv(vInterval));
xClose = close(inv(vInterval));
setShowTitleParameters(eval(Params));
bInit = true;
}
drawLineRelative(7,xClose.getValue(-Lookback),7,xHigh.getValue(-Lookback),PS_SOLID,3,Color.red,2);
drawLineRelative(7,xClose.getValue(-Lookback),7,xLow.getValue(-Lookback),PS_SOLID,3,Color.green,3);
drawShapeRelative(7,b1, Shape.DIAMOND, null, Color.yellow, null, 4);
drawShapeRelative(7,a1, Shape.DIAMOND, null, Color.yellow, null, 5);
return new Array (""+a, ""+b);
}
Attached Files


Comment