Announcement

Collapse
No announcement yet.

Low of last two days

Collapse
X
 
  • Filter
  • Time
  • Show
Clear All
new posts

  • Low of last two days

    Hi

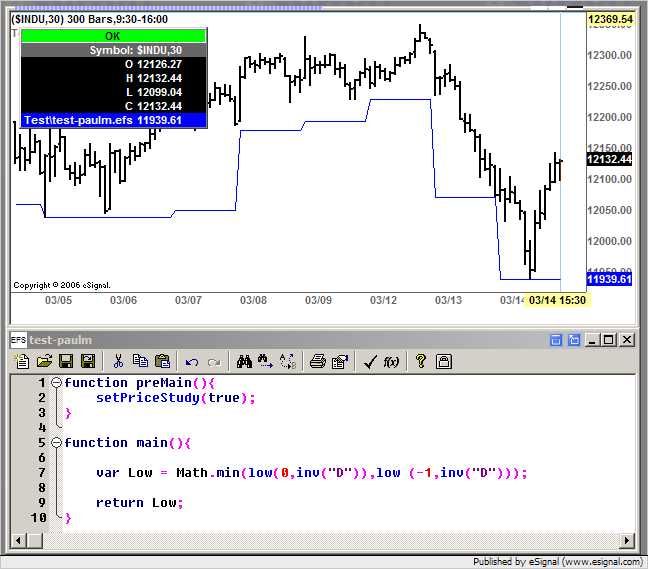
    I want to get the low from today and yesterday ... my call is

    Low = Math.min(low(0,inv("D")),low (-1,inv("D")));

    but it is not returning the correct value ... to be honest I cannot work out what value it is returning!

    I've got this on a 30 min chart

    Any Help much appreciated

    Paul

  • #2
    See if a 2-day donchian channel using daily interval gives you what you're looking for.

    Comment


    • #3
      Thanks much appreciated ... but can anybody tell me why my code does not work???

      Comment


      • #4
        Paul
        Your code appears to be working fine and returning the lowest Low of two days (see enclosed screenshot)
        Alex

        Comment


        • #5
          Alex

          Thanks ... I must be going crazy then ! Too many hours in front of the screen trying to smooth my equity curve!

          I check it again ... and Thanks again

          Paul

          Comment


          • #6
            I'm not going crazy!

            Hi

            Here is my problem ... see attached file. The chart on the left is a 30 min chart, the chart on the right is a daily chart. The little blue lines are the fib levels calculated between

            DailyLow = Math.min(low(0,inv("D")),low (-1,inv("D")));
            DailyHigh = Math.max(high( 0,inv("D")),high(-1,inv("D")));

            So the levels should be the same on both charts which they are ... GREAT but how is it that some of the bars on the 30 min chart (a few bars back) clearly have higher highs than the high on the daily chart and so higher than my 100% fib line (top little blue line)... Am I going crazy?????
            Thanks

            Paul
            Attached Files

            Comment


            • #7
              Paul,

              Your high/low code looks fine. But on the daily chart it looks like the high of the 2nd bar back is over the 100% line too.

              This leads me to suspect something in your line drawing code. If you are willing to post the entire efs I can look at it.

              Steve

              Comment


              • #8
                Please take a look!!!!

                Steve

                Feel free to take a look - THANKS!

                Paul
                Attached Files

                Comment


                • #9
                  Paul,

                  It seems to work properly for all the symbols I tried it on. Perhaps there were some bad ticks that didn't get cleared on your example. The other possibility is the time templates were different for the 2 charts and you were seeing "after hours" trades on the 30 minute. There is nothing wrong with how you are calculating the highs and lows.

                  There were a couple of things in the code you might want to change. In main you may want to change the NEWBAR check to this:
                  PHP Code:
                  if (CurrBarState == BARSTATE_NEWBAR && isLastBarOnChart()) { 
                  That should speed up the loading of the chart. If I remember correctly, CurrentBarIndex will always be zero as the chart is loading.

                  I also noticed it tended to freeze eSignal for a little bit. I suspect it's due to the function CalculateAndDrawKeys() since it keeps adding to KeyVals until it gets very large. Since you didn't comment the code I'm not sure what KeyVals does and if you should be clearing it somewhere.

                  If I commented out lines 215-220 it loaded quickly and I didn't see any freezing of eSignal. I also don't get the yellow background or monthy levels.

                  Steve

                  Comment


                  • #10
                    Thanks - Much Appreciated

                    Steve

                    Thanks ... I really don't know then - must be something on my pc - it's not working on "GBP A0-FX" right now - does sometimes does not others - thanks for the tips - yes I need to reset the KeyVals array ... it just stores the significant levles for fx ... e.g. the x.xx00, x.xx20, x.xx50, x.xx80 for GBP near the current price - thanks again - a mystery indeed!

                    Thanks

                    Paul

                    Comment

                    Working...
                    X